Expiry Without Echo: A Rs 461 Crore Market Closed While India Watched the Monsoon Leave
Every newsroom covered the same story on 30 September: the southwest monsoon had packed up, 13% below normal. Almost nobody covered the other thing that ended that afternoon. RAINMUMBAI — India's first exchange-traded weather derivative, and a market that turned over roughly Rs 461 crore in four months — hit the last expiry on its launch calendar and settled at 2,243.05 mm. No bell, no wrap-up. A new asset class completed its entire first life cycle while the country looked the other way.
What RAINMUMBAI Actually Was
Not a bet on rainfall. A bet on the gap between Mumbai's rainfall and Mumbai's own normal.
The index opened at 2,206.7 mm — the 1991–2020 normals for 1 June to 30 September, averaged across IMD's Colaba and Santacruz observatories. That is the anchor, and it does not move all season. Each day the rain measured at those two stations is compared against the normal for that date and the difference added. Wet day up, dry day down.
So the number on the screen is never "how much it rained". It is a running score of the season against its own climatology, in rupees. Read the closing print of 2,243.05 and you are reading a Mumbai monsoon that finished 36 mm above normal — perfectly ordinary, in a year the country ran 13% short.
The Specification, in One Table
| Underlying | Cumulative deviation of Mumbai rainfall from its long-period normal |
| Stations | IMD Colaba and Santacruz, surface observations, averaged |
| Anchor | 2,206.7 mm (season normal, 1991–2020) |
| Lot size | 1 mm = Rs 50 · tick 1 mm · max order 50 lots |
| Season | 01 June – 30 September |
| Contracts | Four monthly expiries: June, July, August, September 2026 |
| Settlement | Cash, T+2. No delivery, no warehouse, nothing to store |
| Final settlement price | The index value on the expiry day itself |
| Initial margin | 10% minimum · daily price limit 6% / 9% aggregate |
NCDEX Contract Specifications, Mumbai Rainfall Futures, June 2026 and thereafter.
Four contracts traded off that single index, each settling at whatever it read on its own expiry day. A lot was worth about Rs 1.1 lakh — deliberately small, so an individual, not just an institution, could carry one.
How It Performed — a 991 mm Round Trip
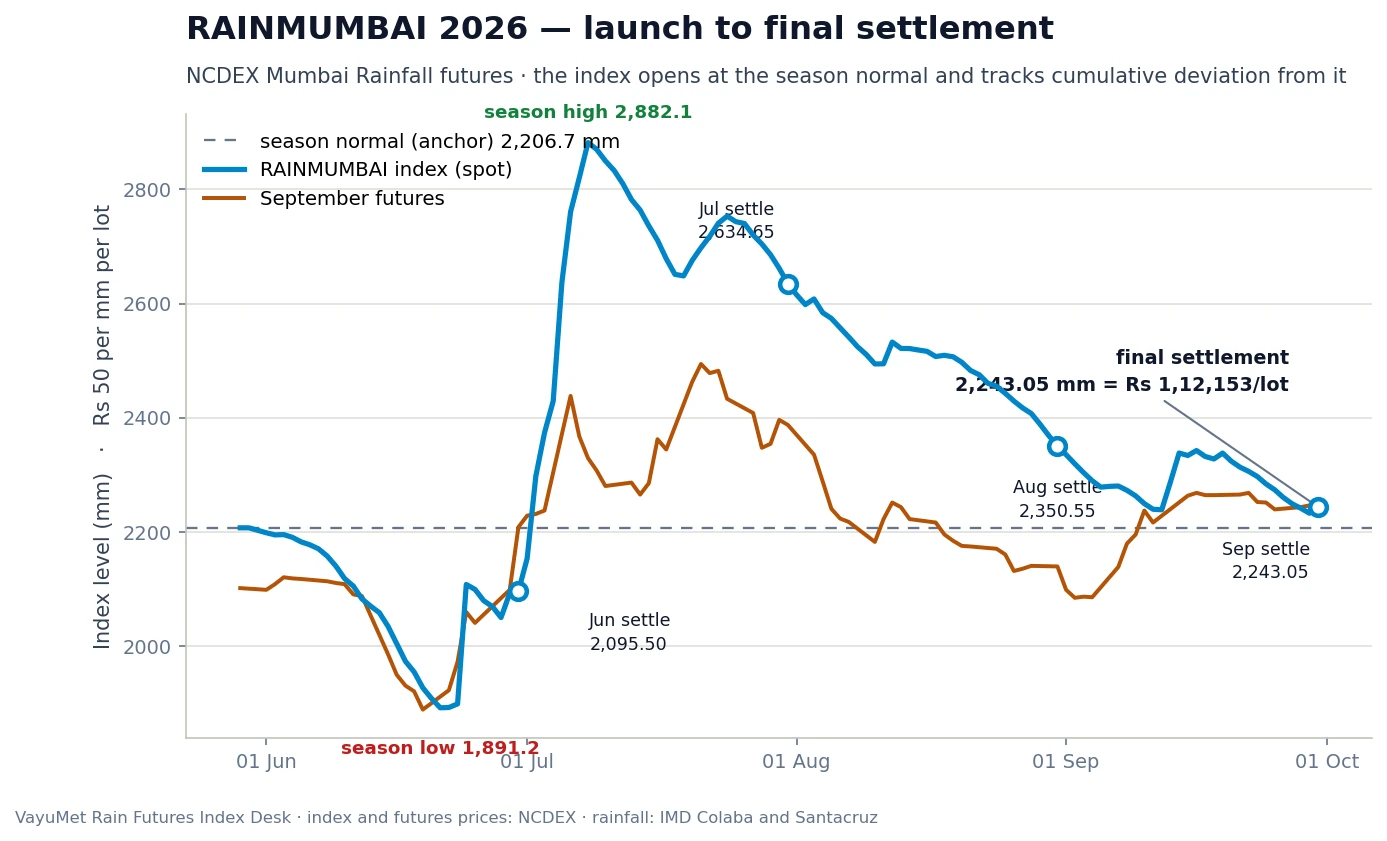
The RAINMUMBAI index and the September futures, 29 May – 30 Sep 2026, with the four monthly settlements marked · index and futures prices: NCDEX
The dashed line is the anchor: above it the season runs wet, below it dry. 2026 did both, violently — bottoming at 1,891.2 on 21 June as the monsoon stalled, then peaking at 2,882.1 seventeen days later after the July deluge. A 991 mm round trip, Rs 49,550 a lot, on 10% initial margin.
| Contract | Settled at | vs anchor | Lot value | Bought at launch, held |
|---|---|---|---|---|
| June | 2,095.50 | −111.2 | Rs 1,04,775 | −Rs 1,325 |
| July | 2,634.65 | +427.9 | Rs 1,31,733 | +Rs 26,033 |
| August | 2,350.55 | +143.9 | Rs 1,17,528 | +Rs 11,828 |
| September | 2,243.05 | +36.4 | Rs 1,12,153 | +Rs 7,103 |
Launch prices are the 29 May opening quotes. One lot = Rs 50 per mm.
The quiet triumph is convergence. On its last trading day the September future printed 2,244; the index it settles against closed at 2,243.05. A gap of 0.95 mm — Rs 48 on a lot worth Rs 1.12 lakh. For a four-month-old product, on an underlying nobody in India had ever priced, that is about as clean a landing as a futures market can make.
Who Would Have Bought, and Who Would Have Sold
A futures market works only if the two sides fear opposite things. Start from the one rule that fixes everything else: the index rises in a wet season and falls in a dry one. A hedge therefore has to pay out on the side that hurts you.
| If a wet season costs you money… | If a dry season costs you money… |
|---|---|
| You BUY the index. Heavy rain pushes the index up, and the long position pays you exactly when your operations are suffering. | You SELL the index. A failed monsoon drags the index below the anchor, and the short gains as your revenue falls away. |
| Construction and infrastructure · outdoor events and film production · quick-commerce fleets · municipal flood-response budgets · motor insurers · bottlers and cold-drink distributors, whose season dies in a cool wet July | Water utilities and reservoir operators — Mumbai's lakes fill only in these four months · hydropower · irrigation-dependent agribusiness in the hinterland |
Illustrative exposure map, not advice. Which way a given firm hedges depends on its specific revenue line.
Notice how lopsided that is. In a coastal megacity, almost everyone's weather problem is too much rain, not too little — so the natural hedging demand piles onto the buy side, and the short side has to come largely from the hinterland and from traders. That imbalance is part of why the book stays thin.
Then there is the third participant, who makes the first two possible: the speculator with a weather view. In 2026 that trade was unusually clean. Buy September at its 19 June low of 1,888 and hold to settlement: +Rs 17,753 a lot; the July contract paid +Rs 35,683 off the same low in six weeks. Chase the peak instead — September at 2,494 on 21 July — and you lost Rs 12,548, more than your margin.
Watching the Forward Value, Live
RAINMUMBAI is off the board until NCDEX lists 2027. Its successor is not: RAINCHNNAI runs the northeast monsoon from 1 September to 31 December on identical mechanics, anchored at 998.25 mm on IMD's Nungambakkam and Meenambakkam gauges.
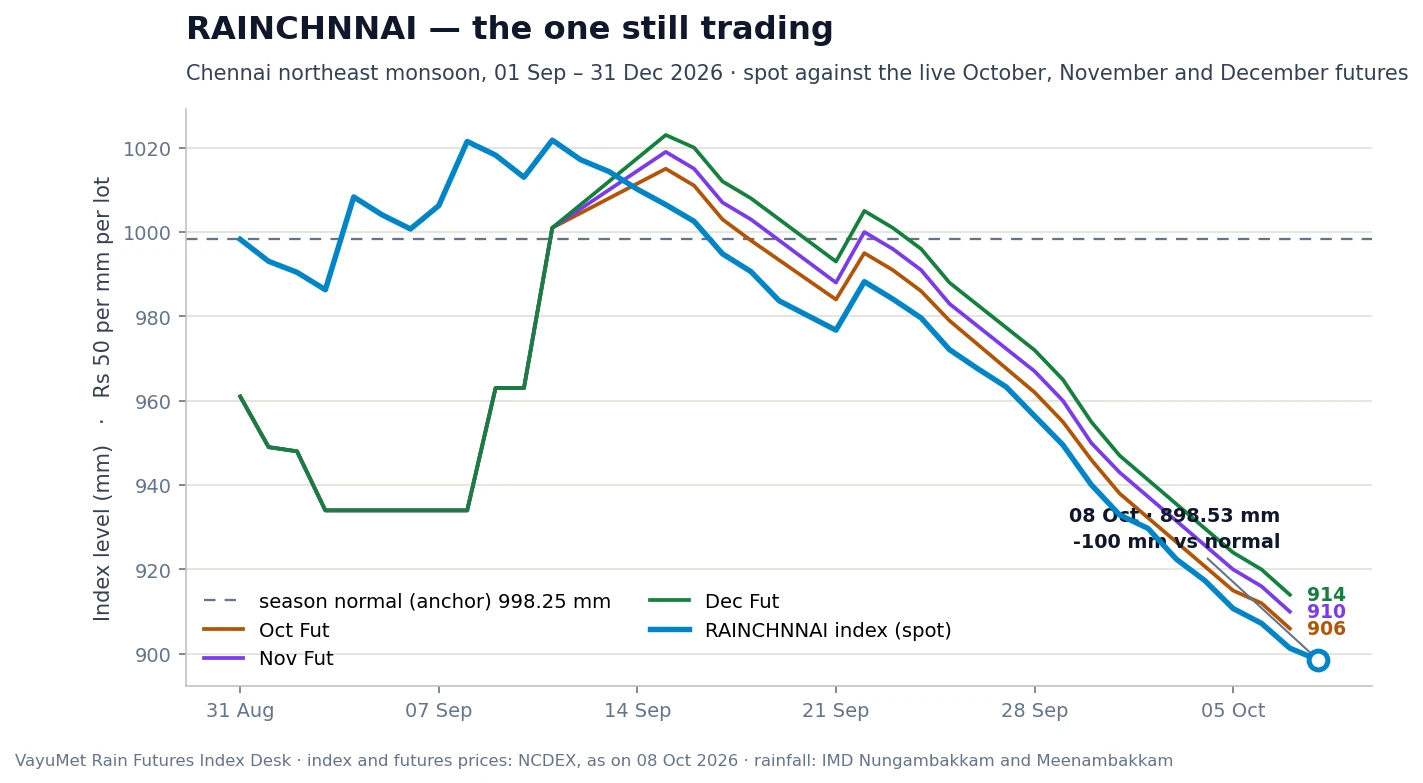
RAINCHNNAI spot against the live October, November and December futures, as on 08 Oct 2026 · the gap between the blue line and the coloured ones is the market's forward view
This is what monitoring a weather derivative looks like. Blue is the settled index; the coloured lines are what the market will pay today for it at each future expiry. On 8 October the index sits at 898.53 mm, a full 100 mm below its anchor — the driest start of five seasons on this date — and the forward curve is in mild contango, December above November above October: the market is pricing some catch-up before the season ends.
VayuMet's Rain Futures Index Desk carries both tickers — official spot, live futures, and the part the exchange does not give you: VM-AIFS and VM-IFS projections of the index out to 14 days, verified daily against the published value. The exchange tells you what the index is; the desk shows where it is heading before the market reprices.
India Against the World — and What Comes Next
Rs 461 crore is about US$52 million. The global weather derivatives market is put at around US$25 billion of notional outstanding, of which the listed portion may be as little as a tenth — the rest trades bilaterally. India's entire first season is therefore roughly 0.2% of the world market, one five-hundredth; against listed products alone, nearer 2%.
Contract size says the same from the other end. A RAINMUMBAI lot settled at about US$1,270; CME's degree-day futures run at US$20 per index point, so a monthly contract there carries some US$20,000 — fifteen times larger. India built a retail-sized instrument: good for getting people through the door, poor for hedging a balance sheet. The direction is still right, though — CME's listed weather volumes rose over 260% in 2023.
Three things decide whether India's version becomes a market or stays a curiosity.
- Liquidity, not interest, is the constraint. September open interest ran at 144 lots in late July; nobody hedging Rs 50 crore gets filled in that book without moving the price. Until market makers commit, these contracts do price discovery, not risk transfer.
- The largest natural hedger is already covered by the state. PMFBY subsidises farm monsoon risk, and a subsidised scheme beats a market price for it. Early demand sits with everyone PMFBY does not serve — power distribution, municipalities, construction, events, insurers.
- Basis risk caps each contract at its city. Colaba-and-Santacruz is exact for Mumbai and useless in Vidarbha, so every new user needs a new location. Expect more cities, then temperature contracts, then strips and options — the sequence CME followed.
Mechanically the experiment worked. But the verdict belongs to Chennai in December, not Mumbai in September: Mumbai proved the machinery, Chennai shows whether anyone wants to hold monsoon risk rather than trade its launch.
Comments
⚠ Disclaimer
This article is market and meteorological commentary, not investment advice, and nothing in it is a recommendation to buy or sell any contract. VayuMet is not a broker, an exchange member or a registered investment adviser. The exposure map above is illustrative. Before taking any decision based on weather forecasts, always consult your national official meteorological broadcaster for authoritative guidance.
Data Source: Index and futures prices from NCDEX, as carried by the VayuMet Rain Futures Index Desk · Contract mechanics from NCDEX's published Contract Specifications and Spot Calculation Methodology for the Mumbai Rainfall Futures Contract · Underlying rainfall: IMD Colaba and Santacruz, normals 1991–2020 · NCDEX has published first-month volume only (about 20,000 lots); the Rs 461 crore season turnover is the figure carried by the VayuMet desk, not an exchange publication, and the dollar conversion uses a rupee near 88 · Global market size and CME contract terms are from published industry estimates and CME's own materials · Profit and loss figures are illustrative gross moves per lot and exclude brokerage, exchange fees, taxes, margin funding and intra-season mark-to-market.