Thirteen Percent Down, a Hundred Stories Up: Monsoon 2026's Patchwork of Extremes
The 2026 southwest monsoon is over, and it goes into the record as 13% below normal — a below-normal season, but not a drought year, and the kind of number that fits in a headline and settles nothing. Because −13% is an average, and an average is a story about a country that does not exist. Resolve the same four months to 724 districts and the season runs from −91% to +104%. Fourteen states contain both a district that lost most of its rain and a district that got half as much again as it should have. Uttar Pradesh finished the season at +8% while holding both. Below are the two maps that show it, and the four-act story of how a catastrophic June turned into a merely disappointing year.
First, the Picture Everybody Publishes
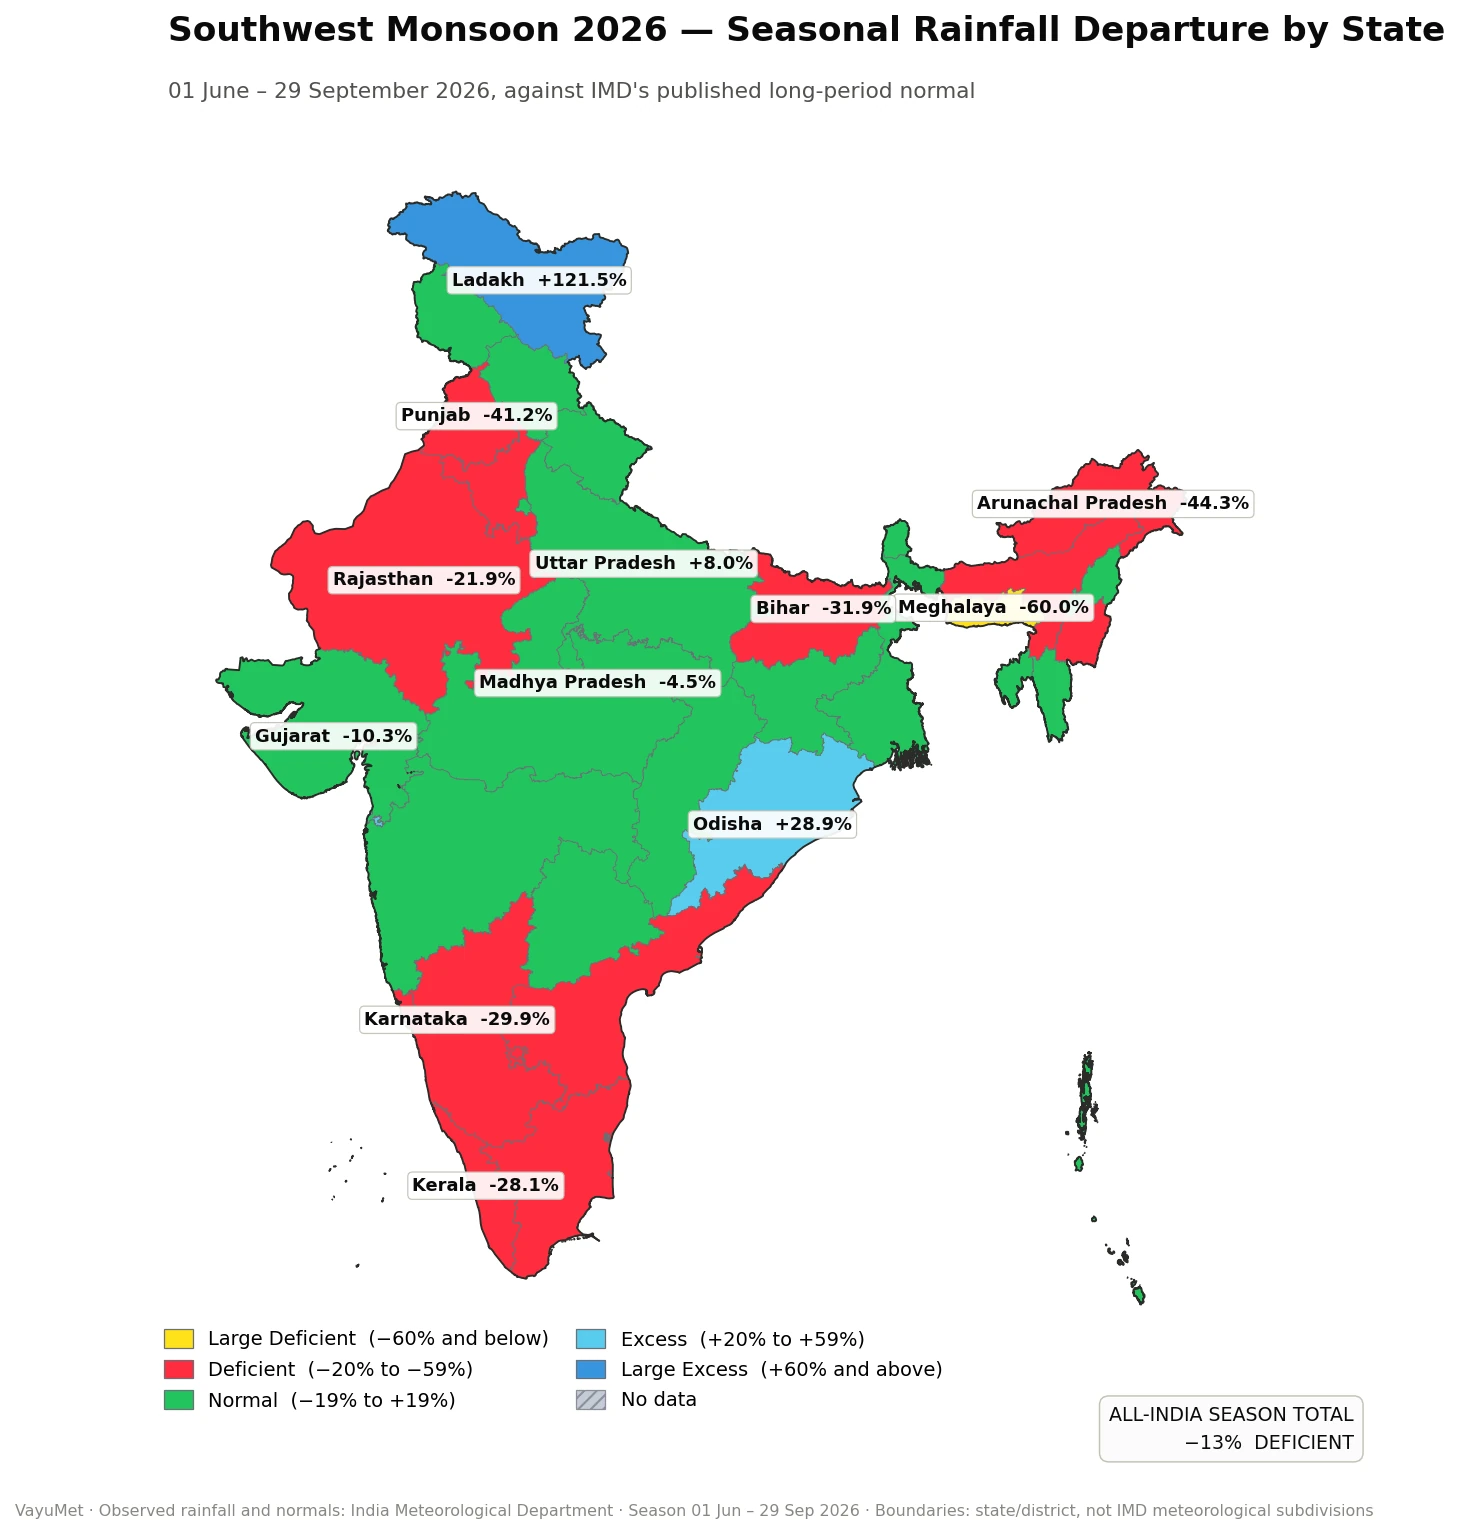
Seasonal rainfall departure by state, 01 Jun – 29 Sep 2026, against IMD's published long-period normal · IMD departure classes and IMD's standard rainfall colours · boundaries are state polygons, not IMD meteorological subdivisions
At state resolution the season reads as a familiar geography of disappointment. The northeast carries the worst of it — Meghalaya −59.6%, Manipur −44.7%, Arunachal Pradesh −43.6% — which is remarkable in a region whose problem is normally too much rain, not too little. The other deep red is Punjab at −41.7%, and the southern peninsula is uniformly short: Karnataka −30.0%, Kerala −27.1%, Andhra Pradesh −23.2%, Tamil Nadu −18.3%.
Against that, only two patches of blue matter. Odisha finished +30.5%, the standout surplus of the season, and the Ganga plain held up — Uttar Pradesh +8.2%, Uttarakhand +7.6%, West Bengal +2.9%. Ladakh's +122% looks dramatic and means very little: its seasonal normal is around 22 mm, so a few extra showers swing the percentage wildly. Percentages on tiny normals are the most over-read number in Indian rainfall reporting.
Even here the national figure is already misleading. Fifteen of thirty-seven states and union territories finished Deficient or worse. The country as a whole did not.
Now Zoom In, and the Average Falls Apart
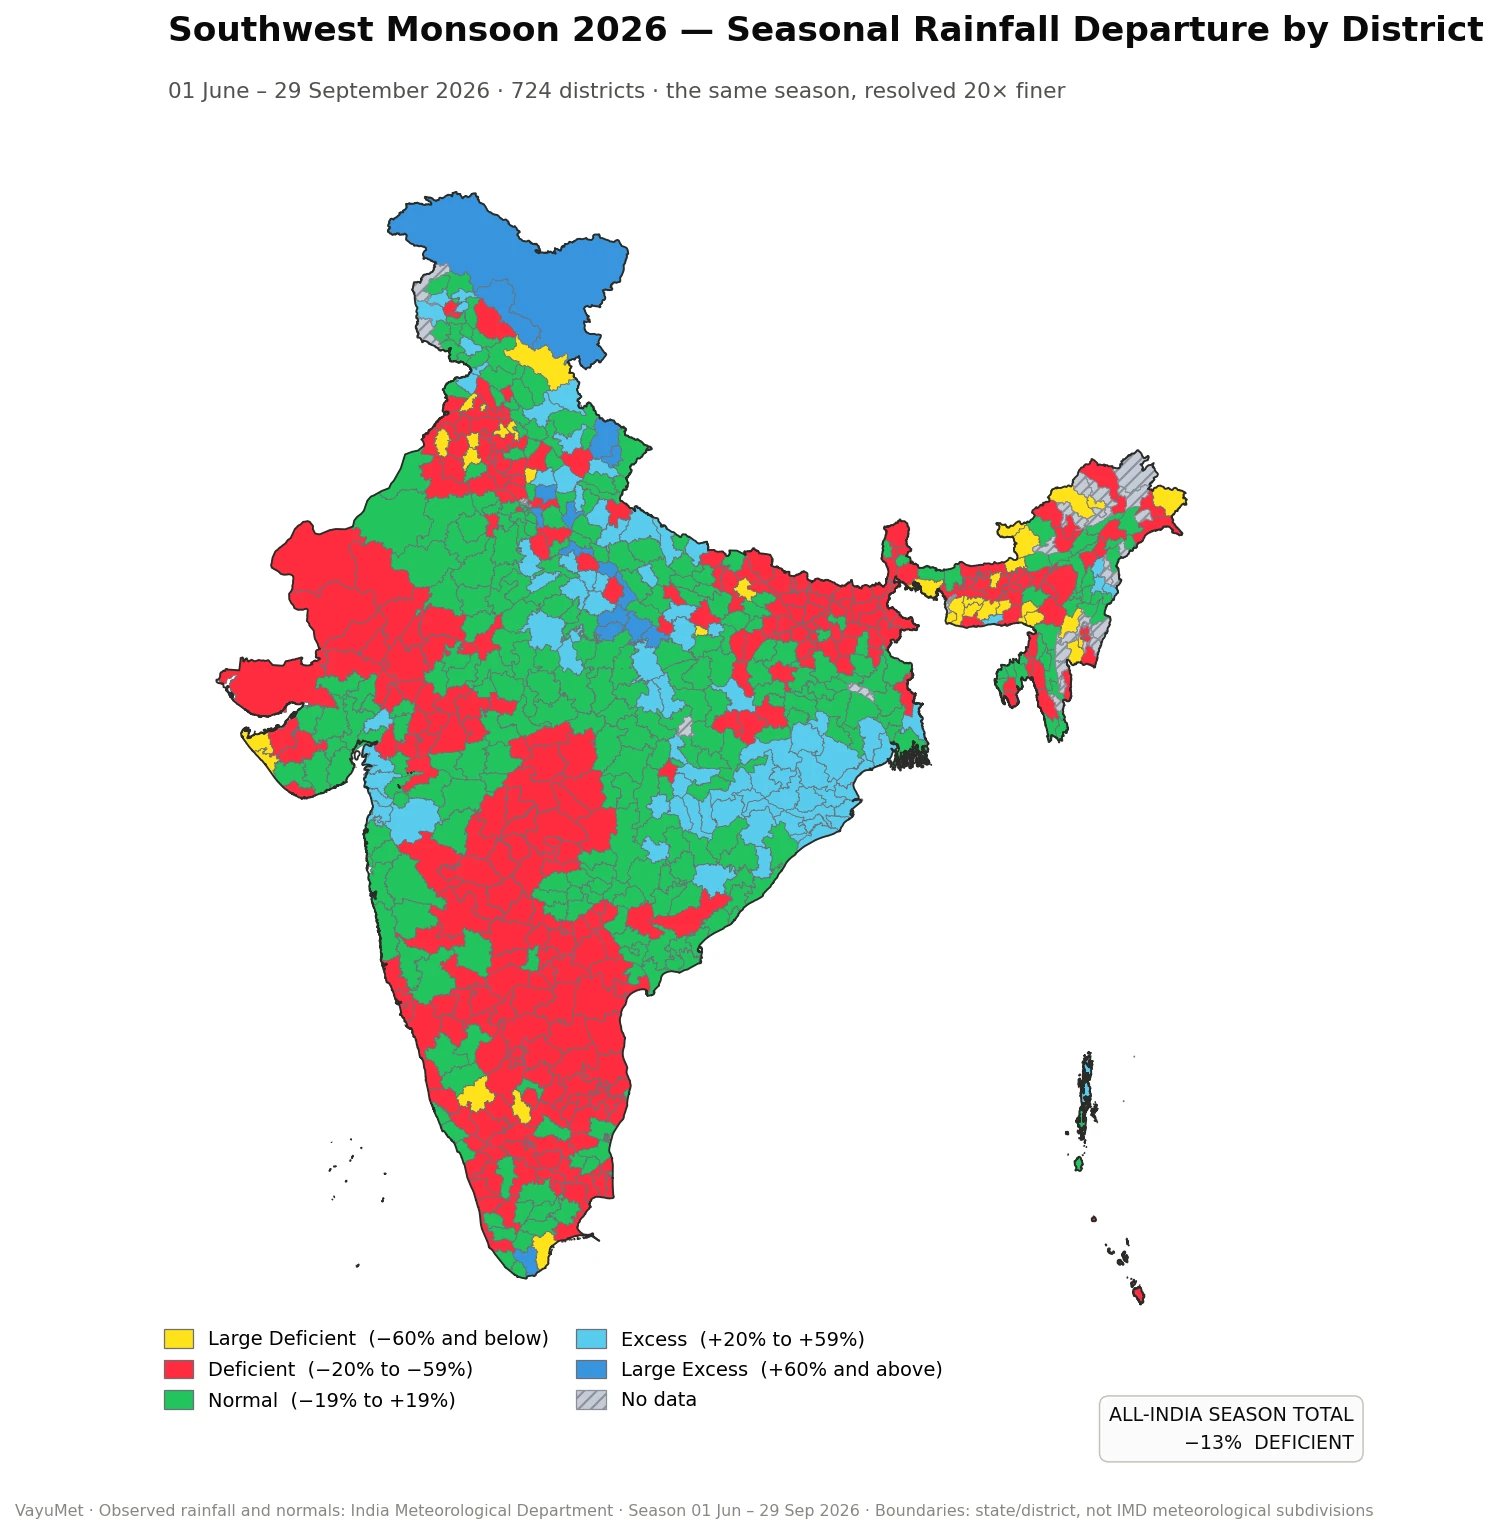
The same season, the same data, resolved to 724 districts · IMD departure classes and colours · 01 Jun – 29 Sep 2026 · 31 districts have no published IMD figure and are hatched
This is the map that should be published alongside the number. The smooth state blocks dissolve into a mosaic. A corridor of blue runs inland from the north Bay of Bengal coast — Odisha, Jharkhand, eastern and central Uttar Pradesh, Bundelkhand — and almost everything west and south of it is red. Deficit and surplus sit side by side across district lines, sometimes within sight of each other.
| IMD class | Departure | Districts | Share |
|---|---|---|---|
| Large Deficient | −60% and below | 35 | 4.8% |
| Deficient | −20% to −59% | 280 | 38.7% |
| Normal | −19% to +19% | 307 | 42.4% |
| Excess | +20% to +59% | 87 | 12.0% |
| Large Excess | +60% and above | 15 | 2.1% |
724 districts with a published IMD figure, 01 Jun – 29 Sep 2026.
Fewer than half the districts in India — 42% — actually had a normal season. Nearly 44% finished Deficient or Large Deficient, and 14% finished in surplus. The single national figure of −13% describes the arithmetic of that distribution; it describes the lived experience of almost nobody.
The extremes are worth naming. Ramanagara in Karnataka finished −91.5%, with 39 mm of rain across four monsoon months. Churachandpur in Manipur −79.8%, West Jaintia Hills in Meghalaya −79.3%, Mansa in Punjab −72.0%. At the other end, Gautam Buddha Nagar in Uttar Pradesh took +103.7%, with Sambhal, Mahoba, Hamirpur, Kanpur Nagar and Banda all between +77% and +97% — the Bundelkhand and central-UP belt doubled its season. Two districts sit higher still — Bageshwar at +163% and Tirunelveli at +338% — but both have small seasonal normals, and those percentages rest on modest absolute totals.
The clearest illustration is Uttar Pradesh. The state average is +8.2%, which reads as a perfectly ordinary season. Inside it, districts run from −67.8% to +103.7% — a 171 percentage-point spread under a single number that says "normal". Fourteen states and union territories contain both a Deficient district and an Excess one. Tamil Nadu spans 402 points, Uttarakhand 203, Meghalaya 127, Gujarat 113, Punjab 107.
The Season in Four Acts
The other thing the seasonal total hides is that this was not one season. It was a disaster followed by a rescue.
| Month | All-India departure | What drove it |
|---|---|---|
| June | −32.9% | A slow, stalling advance and almost no organised systems |
| July | +3.6% | Bay of Bengal lows and depressions begin forming and tracking inland |
| August | −12.8% | A weaker, more intermittent system train |
| September | −7.2% | Late systems, including the Deep Depression of 23–25 September |
| Season | −12.7% | Rounds to the published −13% |
All-India observed departures, VayuMet Monsoon Monitor; September to 29 Sep.
A −33% June is drought territory. Had the rest of the season continued at that rate, 2026 would be remembered very differently. What changed in July was the Bay of Bengal. The surplus corridor on the district map is not a coincidence of geography — it is a track. Low pressure areas and depressions forming over the north Bay and moving west-northwest across Odisha, Chhattisgarh, Madhya Pradesh and up the Ganga plain lay rain down in a band, and that band is precisely where the blue sits.
The recovery was not a general strengthening of the monsoon — the southern peninsula and the northwest stayed dry throughout. It was narrow, system-driven rainfall along a repeated track. Districts under that track did well; districts a few hundred kilometres either side did not. That is how a country ends up with a −13% average and a 195-point spread.
What This Season Should Change
Intraseasonal variability did the work, not the seasonal mean. A forecast that called 2026 "slightly below normal" would have been right and useless. Sowing windows, reservoir draw-down and insurance triggers turned on a June that failed and a July that rescued it — not on a number that only existed once the season was over.
The unit has to be the district, not the state. A state average of +8% and a district reality of −68% cannot guide the same decision, and the state average is the one that gets quoted. And in a season carried by a few Bay systems on a repeated track, the difference between a good year and a bad one is largely which side of the track you farm.
A note on boundaries. These maps are drawn on state and district polygons, not on IMD's 36 meteorological subdivisions, which are the units IMD's own published seasonal map uses. Subdivisions cut across state lines in several places, so individual patches of shading will not match IMD's map exactly. The country figure is the same: −13% for the season.
Comments
⚠ Disclaimer
VayuMet's analysis is based on NOAA GFS model output and represents independent meteorological assessment. Before taking any decision based on weather forecasts, always consult your national official meteorological broadcaster for authoritative guidance.
Data Source: This article uses observed rainfall, not model output. Actual rainfall and long-period normals are the India Meteorological Department's published district and state figures, read through the VayuMet Monsoon Monitor · Season window 01 Jun – 29 Sep 2026, the last complete observed read before IMD's cumulative window rolled over to the post-monsoon season; IMD's season formally closes 30 September, so the final three days are not included and the figures may move marginally against IMD's end-of-season statement · Departures are mapped on state and district polygons, not IMD meteorological subdivisions · Districts with very small seasonal normals (Ladakh, parts of southern Tamil Nadu) produce large percentage departures on small absolute amounts and should be read with that in mind