A Cyclone's Heartbeat: The Hidden Story in Pressure Rise and Fall
📉 Every cyclone bulletin gives you one number for pressure — the central value, today. It tells you how strong the system is. It tells you nothing about what it is doing. The chart below is the one forecasters actually lean on and almost nobody publishes: how much the pressure has changed in the last 24 hours, at every point on the map. On it, the Bay system reads as a moving dipole — a deep red core of falling pressure out ahead, a spreading blue halo of rising pressure in the wake. At its most violent the VayuMet model has the fall touching −32 hPa in 24 hours, with +26 hPa of rise behind it. That is not a subtle signal. 🌀
🎞️ Thirteen Frames of a System Inhaling, Then Exhaling
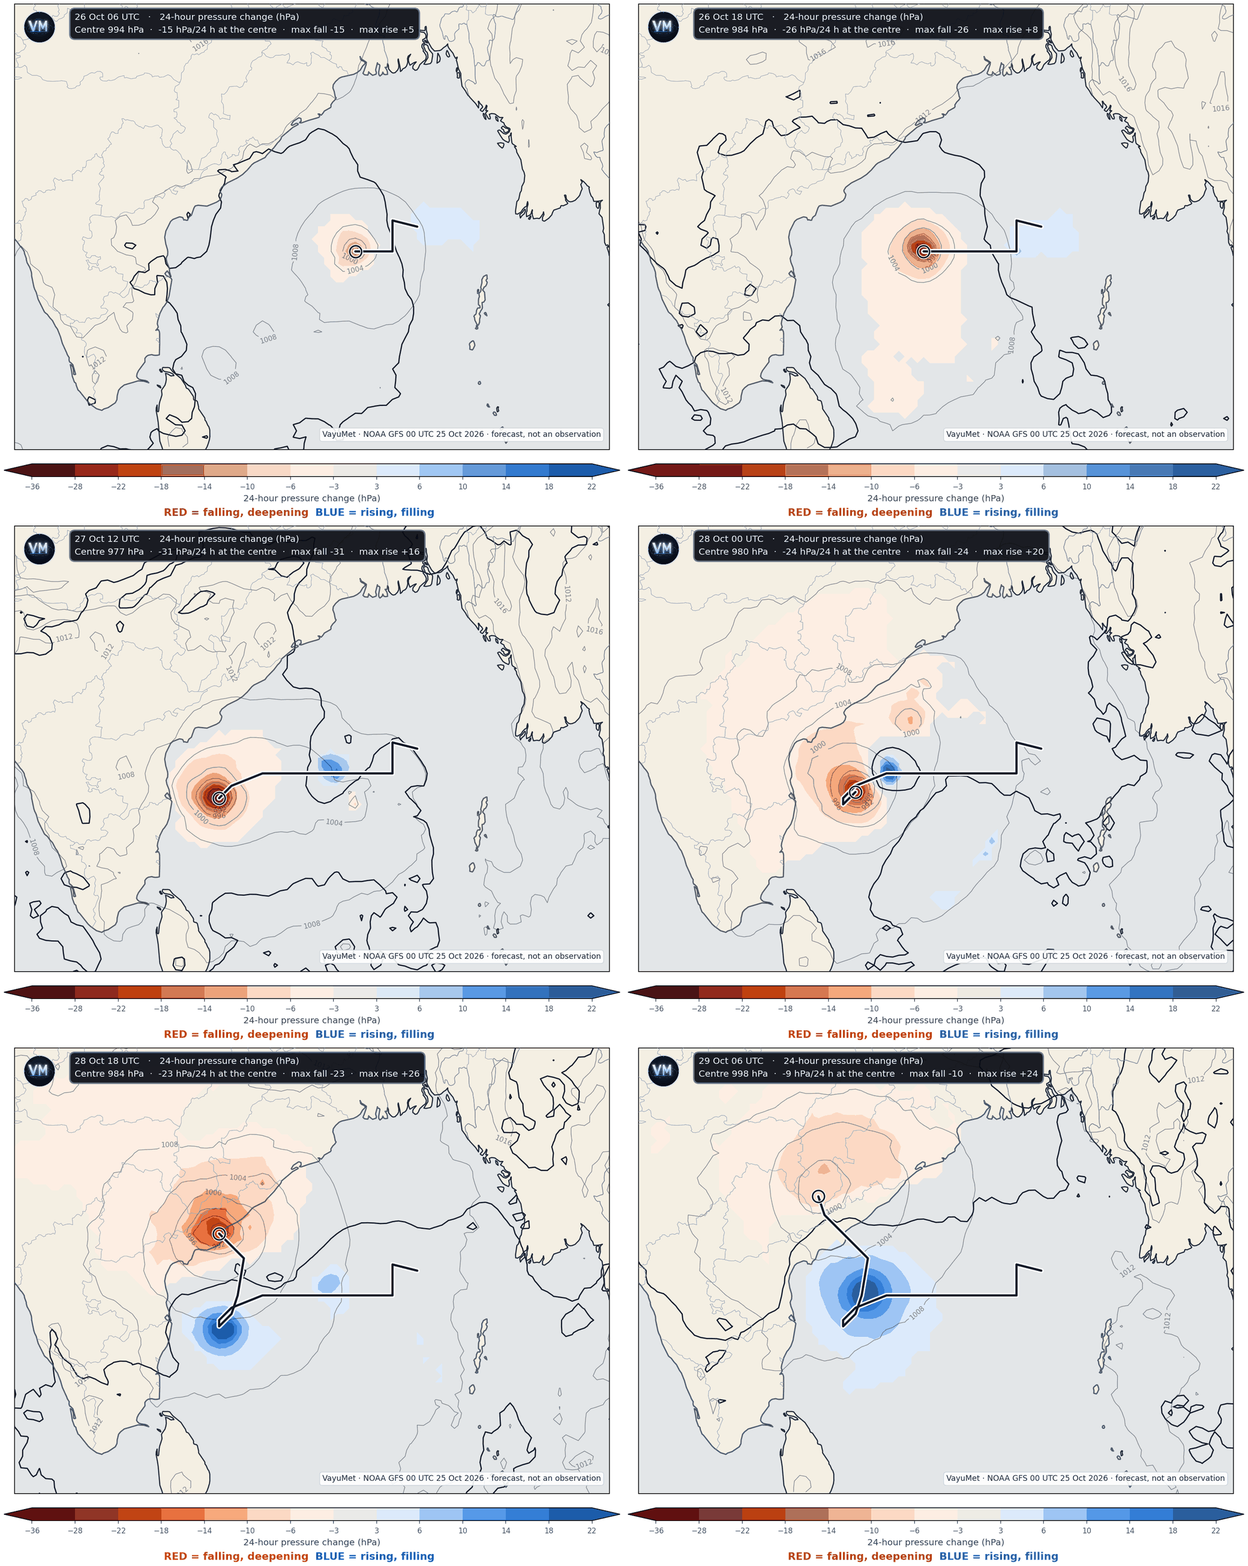
24-hour pressure change, every 6 hours, 26 Oct 06 UTC – 29 Oct 06 UTC · red = falling and deepening, blue = rising and filling · thin grey lines are mean sea level pressure, the black line is the zero-change boundary · VayuMet, NOAA GFS 00 UTC 25 Oct 2026 · forecast, not an observation
Three things to watch. The red core tracks with the centre and always sits slightly ahead of it — pressure falls first where the storm is going, not where it has been. The blue area grows behind and keeps growing even after the red starts to fade. And the black zero line between them sweeps across the map like a wave front. That line is the moment-by-moment answer to "has it arrived yet?"
🧭 Why Forecasters Live on This Chart
Pressure tendency is one of the oldest tools in operational meteorology and still one of the sharpest, because it converts a static snapshot into a rate. Four things a forecaster reads off it in seconds:
- Is it deepening or filling? A central value of 980 hPa means one thing if it was 1000 hPa yesterday and something completely different if it was 975. The first is a system still winding up; the second has already peaked. Only the tendency tells them apart.
- Where is it going? A system moves toward the fall. The red centre of mass runs ahead of the storm, so the tendency field is a short-range steering hint that needs no model track at all.
- Where will the wind be worst? Wind responds to the pressure gradient, and the tightest gradients build where a strong fall sits next to a strong rise. The seam between the red and the blue on this chart is where the isobars pack and the wind accelerates — the classical isallobaric effect.
- Has the worst passed? At a coastal station the switch from falling to rising is the cleanest signal there is that the centre has gone by. It is also the most dangerous moment to misread: in a cyclone, pressure bottoming out means the eye, and the second half of the wind is still to come, from the opposite direction.
📏 So What Does a 20 hPa Change Actually Mean?
It means a lot, and the way to see that is to compare it with the yardstick meteorologists use for explosive development. The textbook definition of a "weather bomb" is a fall of 24 hPa in 24 hours at 60° latitude, scaled by the sine of the latitude. Run that scaling down to the Bay of Bengal at 14°N and the equivalent threshold is only 6.7 hPa in 24 hours.
| 24-hour pressure change | What it signifies |
|---|---|
| ±1 – 3 hPa | Ordinary day-to-day variation. Noise. |
| −5 hPa | A system is organising. Worth watching. |
| −6.7 hPa | Rapid-deepening threshold at this latitude — the tropical equivalent of a weather bomb. |
| −20 hPa | Three times that threshold. Intensification fast enough that a 12-hour-old forecast is already stale. |
| −32 hPa | What this run shows at peak — nearly five times the threshold. |
| +20 hPa | Equally dramatic in reverse: the ridge rebuilding behind the storm, and the gradient that keeps coastal winds up long after the centre has passed. |
Threshold from the standard latitude-scaled rapid-deepening criterion; changes are VayuMet model output.
So when the chart shows a 20 hPa fall over the central Bay, it is not saying "a storm is coming". It is saying a storm is being built, in front of your eyes, faster than the Bay normally builds one. ⚡
🛰️ The Track, and What Rides With It
The system is near 15.5°N, 90°E this morning at about 1,003 hPa — a Depression, winds around 50 km/h. From there the model runs it west, deepens it hard through the 26th and 27th, loops it south and then recurves it back north to the coast.
| Valid (UTC) | Position | Centre | 24 h change | Stage |
|---|---|---|---|---|
| 25 Oct 06Z | 15.5°N 90.3°E | 1003 hPa | — | Depression |
| 26 Oct 06Z | 14.5°N 87.8°E | 994 hPa | −15 | Cyclonic Storm |
| 26 Oct 18Z | 14.5°N 85.5°E | 984 hPa | −26 | Severe Cyclonic Storm |
| 27 Oct 06Z | 14.0°N 82.8°E | 977 hPa | −32 | Severe Cyclonic Storm |
| 27 Oct 18Z | 13.3°N 82.3°E — loops south | 979 hPa | −28 | Very Severe Cyclonic Storm |
| 28 Oct 18Z | Coast crossing near Kakinada | 984 hPa | −23 | Cyclonic Storm |
| 29 Oct 06Z | Inland, Sukma (Chhattisgarh) | 998 hPa | −9 | Depression |
Single deterministic run. Note how the tendency turns before the central pressure does — the clue that the peak has passed.
Severe weather, by day. 🌧️
- 27 Oct — Heavy Rain over Chennai; red gust alerts 65–80 km/h over Tirupati, Krishna, Thiruvallur, Nellore and Chennai as the storm's southern flank brushes the Tamil Nadu and south Andhra coast.
- 28 Oct — the main event. Very Heavy Rain over Visakhapatnam, Anakapalli, Kakinada and Gajapati; Heavy Rain over East Godavari and Alluri Sitharama Raju. Red gust alerts 80–93 km/h across Alluri Sitharama Raju, Kakinada, Eluru, East Godavari, Anakapalli and Vizianagaram.
- 29 Oct — the rain goes inland and north: Very Heavy over Umaria, Heavy over Anuppur, Shahdol, Dindori (Madhya Pradesh) and Rajnandgaon, Narayanpur (Chhattisgarh), with red gusts 74–77 km/h across east Uttar Pradesh and Bihar.
- 30 Oct — a remarkable tail: Very Heavy Rain over Sikkim, Kalimpong and Darjeeling as the remnant moisture runs up against the hills. 🏔️
🏷️ Still Nameless — For Now
One thing has not changed since our last update: the system has no name, because it is still a depression. Names are assigned only at Cyclonic Storm intensity — 62 km/h of sustained wind — and until then a system carries a number, not a name. The model crosses that line on 26 October.
When it does, the name is already decided and waiting. The next unused entry on the North Indian Ocean list is Arnab, Bangladesh's contribution, meaning "ocean" in Bengali. The 2026 season has run seven depressions without using a single name; this would be the first.
⚠️ The honest caveat. This is one deterministic run at two to four days' lead, and the landfall point has already moved twice across successive runs — Kendrapara, then Srikakulam, now Kakinada. The tendency pattern is robust: systems that deepen this fast always show this dipole, and the fall-ahead/rise-behind structure is physics, not a model quirk. The exact numbers and the exact coast are not. Follow IMD bulletins and your State Disaster Management Authority — model guidance sets your posture, only the official warning sets your actions.
Comments
⚠ Disclaimer
VayuMet's analysis is based on NOAA GFS model output and represents independent meteorological assessment. Before taking any decision based on weather forecasts, always consult your national official meteorological broadcaster for authoritative guidance.
Data Source: NOAA GFS 00 UTC 25 Oct 2026 · The 24-hour pressure change is computed inside VayuMet as the mean sea level pressure field minus the same field 24 hours earlier in the same run; the animation therefore begins at 26 Oct 06 UTC, the first step for which a full 24-hour difference exists within this run · Centre positions, central pressure and stage derived from the run's own pressure and 10 m wind fields · The system is not yet named; names are assigned only at Cyclonic Storm intensity, and the stages here are this run's wind speeds placed on the standard cyclone scale · Rain and gust warnings: VayuMet district warning system, IMD rainfall categories · Rapid-deepening threshold: the standard latitude-scaled criterion (24 hPa/24 h at 60°, scaled by sine of latitude).