Arnab Is Gone — But Will Another Cyclone Rise?
🌀 Cyclone Arnab crossed the Andhra Pradesh coast near Yanam between 02:00 and 08:00 IST on 28 October, took more than six hours to complete the crossing, and was a depression over land by that evening. Two days on, the observations are in — and this is the part of forecasting nobody enjoys and everybody should publish: what we said would happen, next to what did. Then the harder question. There is already another system crossing the Bay behind it, and the ocean Arnab left behind is not the ocean it found. 🌊
🌧️ What Actually Fell
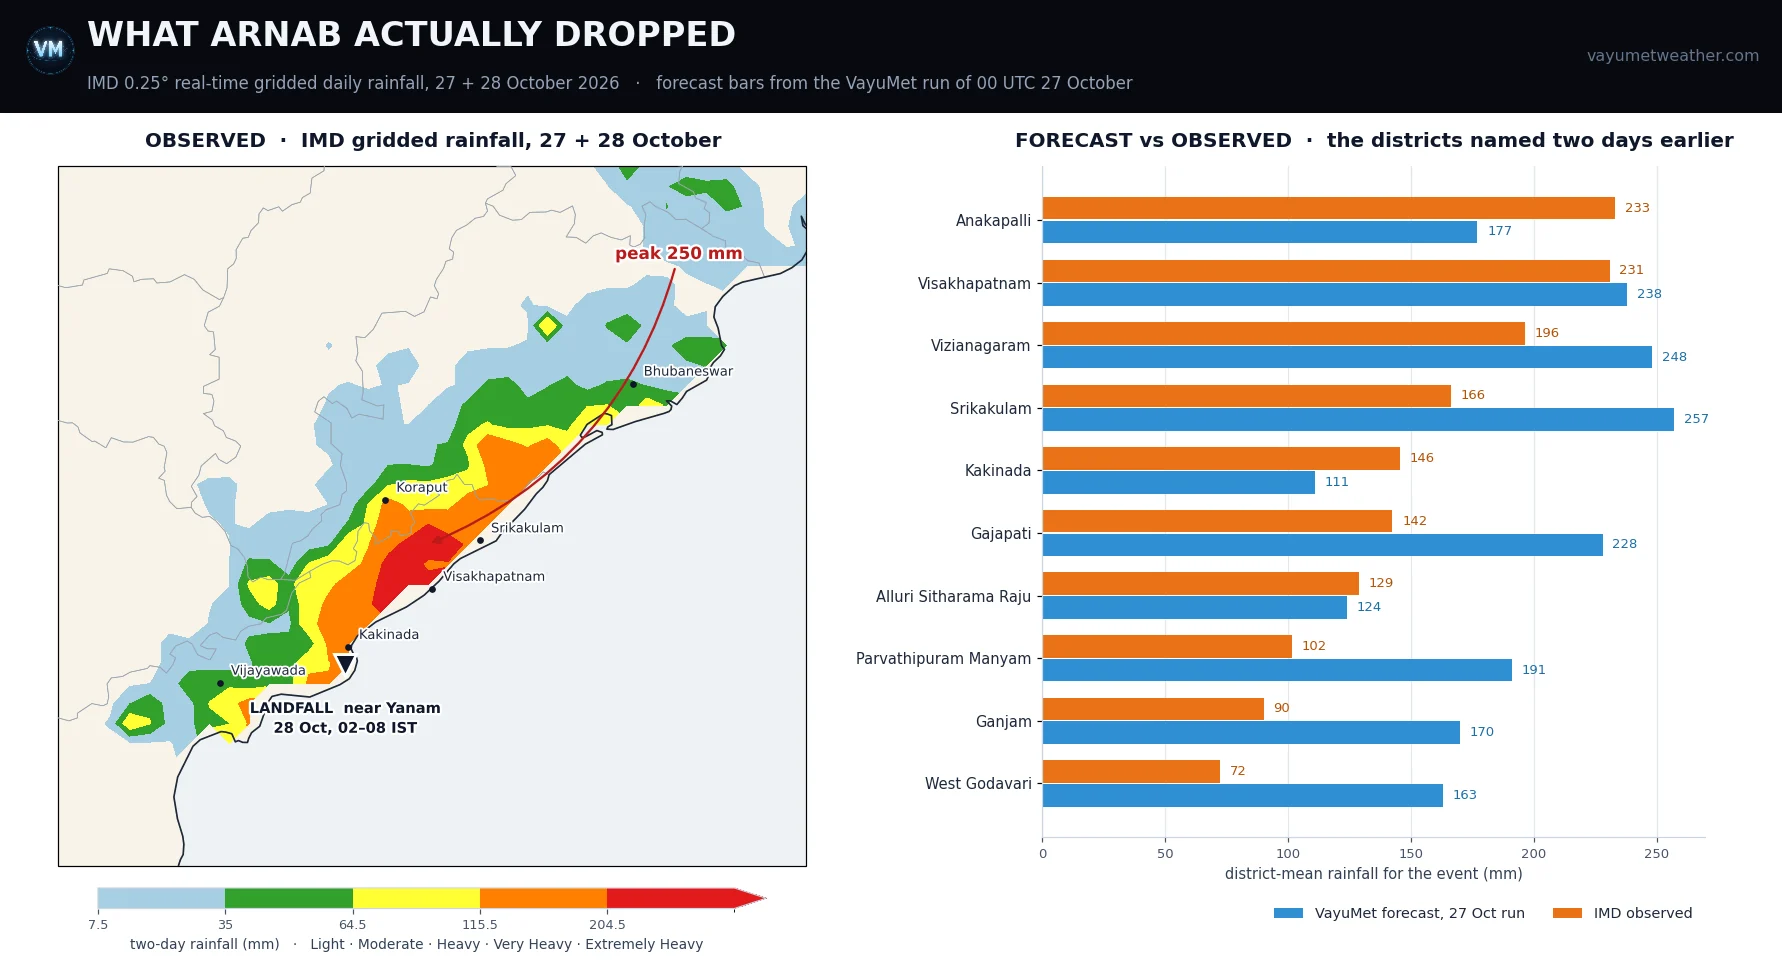
Left: observed rainfall, IMD 0.25° real-time gridded daily grids for 27 + 28 October, shaded on IMD categories. Right: the ten districts the 27 October article put a number against, forecast beside observed · district means
The two-day total peaks at 250 mm near 18.25°N 83.25°E — the hill country where Alluri Sitharama Raju, Vizianagaram and Visakhapatnam meet. Extremely Heavy Rain (≥ 204.5 mm) was reached at grid points across those three districts and Anakapalli. Inland in Koraput 173 mm fell on hill slopes; Gajapati and Ganjam took 167 mm and 192 mm at their wettest points.
The grid holds up against the ground. For the landfall day alone, press accounts put Visakhapatnam near 220 mm, Koraput 188, Ganjam 161 and Gajapati 135; the gridded field gives 229, 173, 139 and 160 mm. Close enough to trust — and a reminder that a 0.25° cell is an area average, not a rain gauge.
📏 How the Forecast Did — the Shape Right, the Amount Too Generous
Two days earlier VayuMet published district totals for this event with a specific structural claim: that because the storm would turn north almost immediately after crossing, the heaviest rain would fall to the right of the track, along the north Andhra and south Odisha coast rather than at the landfall point. That is what happened — the observed maximum sits about 200 km up-coast from Yanam.
The amounts were another matter. Across the ten districts named, the forecast ran 40 mm too wet on average — roughly a quarter high — with a mean absolute error of 59 mm. Two landed within 10 mm (Visakhapatnam, Alluri Sitharama Raju); two were badly over (Srikakulam 257 forecast against 166 observed, West Godavari 163 against 72); Anakapalli and Kakinada came in wetter than forecast. The timing was fast by six to ten hours.
📌 The honest summary. The pattern was right and useful — the right-of-track maximum, the Eastern Ghats landslide risk and the coast that would take the gusts were all correctly placed two days out. The magnitudes were not. That is a normal, usable forecast, and it is why a model number is a posture, not an instruction.
💔 The Cost, As Far As the Reports Agree
The damage picture from open sources is still unsettled, and the disagreements are worth naming rather than averaging away:
- Deaths: the Chief Minister's office confirmed five; the NDRF counted three; later reports put the toll between seven and nine. No consolidated official figure yet.
- Agriculture: the Agriculture Minister's preliminary estimate is 2.24 lakh hectares across 14 districts, some 3.45 lakh farmers; the Chief Minister's letter to the Centre cited about 70,900 hectares. Not reconciled.
- Power: around 15,000 electricity poles uprooted; 31 houses damaged on the NDRF's count; flights to Visakhapatnam and Vijayawada cancelled on the 28th.
- Before landfall: more than 1.8 lakh people evacuated — the single biggest reason the toll is in single digits. ₹5 lakh announced per victim's family.
Odisha took flooding in Ganjam, Gajapati and Koraput, and the moisture reached far enough inland to be felt in Uttar Pradesh and Sikkim — the long tail flagged here two days ago, when the model put 10–15 mm as far away as Delhi NCR.
🌀 And Behind It, the Next One Is Already Moving
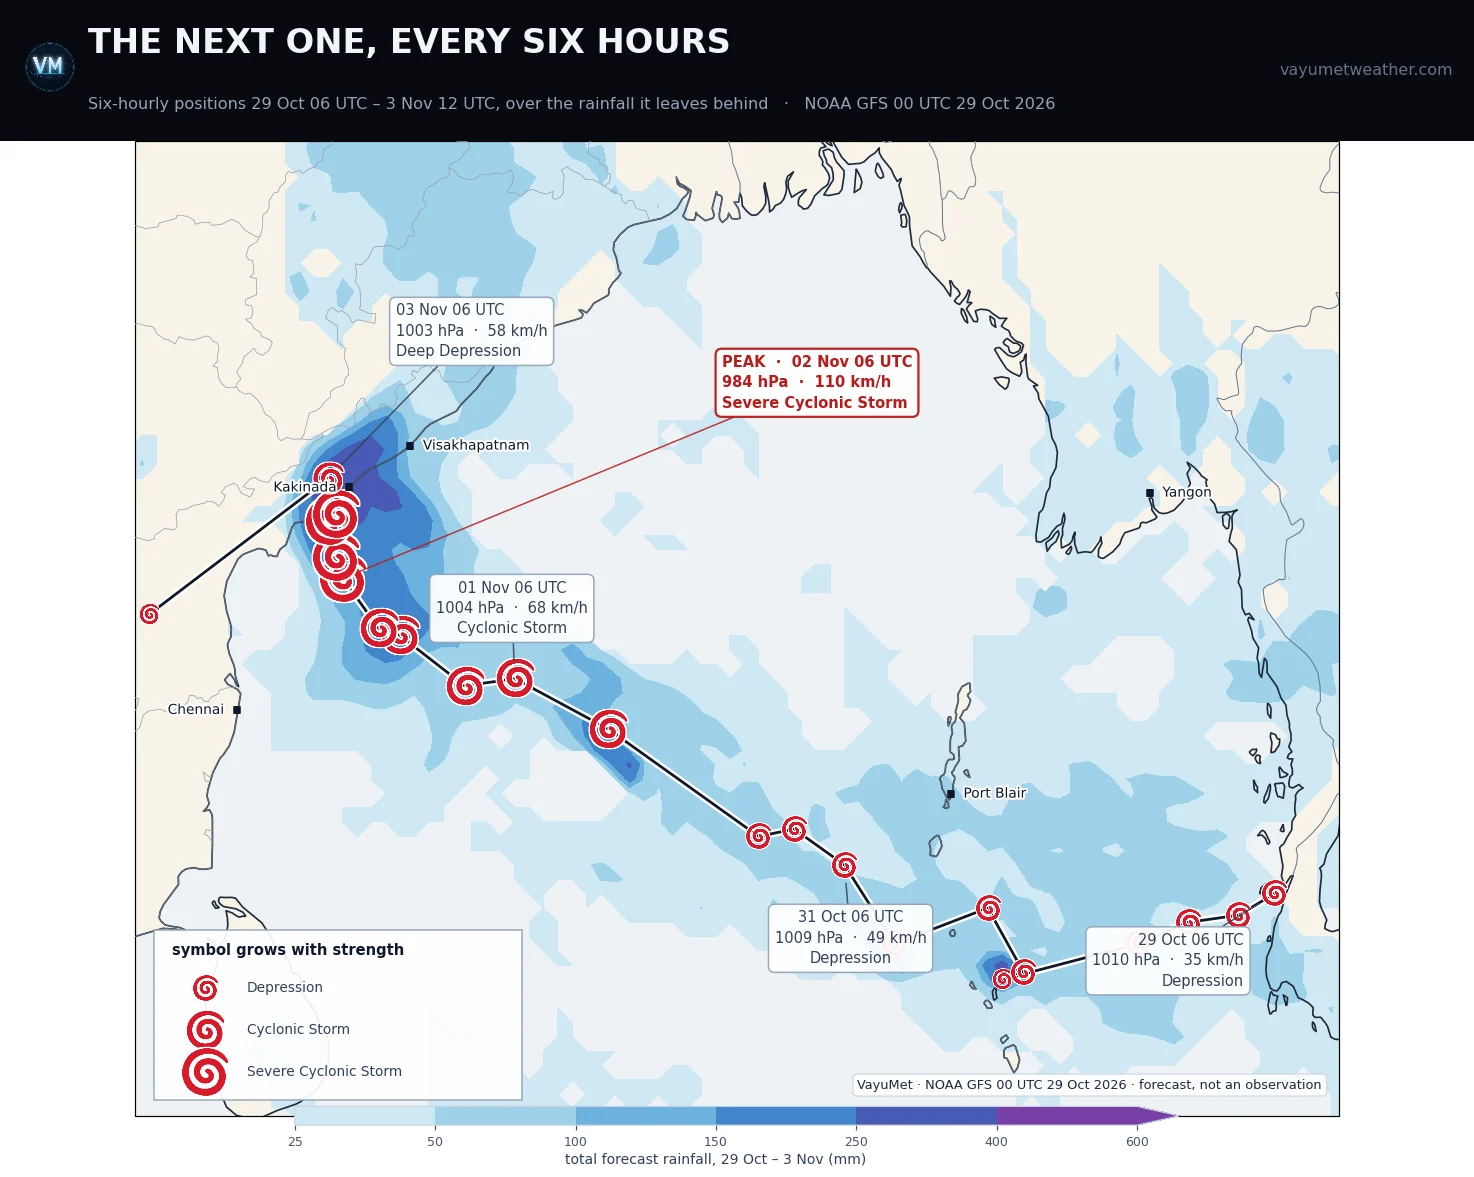
Position every six hours, 29 Oct 06 UTC – 3 Nov 12 UTC · the cyclone symbol grows with intensity · shading is the total rainfall over the whole period · VayuMet, NOAA GFS 00 UTC 29 Oct 2026 · forecast, not an observation
The run picks up a weak low near 9.9°N 98.4°E this morning, close to the Gulf of Martaban. It drifts west as nothing more than a depression for two full days — 1008 to 1011 hPa, 32 to 49 km/h — before anything happens. Then:
- 1 Nov — reaches Cyclonic Storm strength, 1001 hPa, 67 km/h, near 12.8°N 86.8°E
- 2 Nov, 06 UTC — peaks at 984 hPa and 110 km/h, Severe Cyclonic Storm strength, near 15.4°N 82.1°E
- 2–3 Nov — crosses the Andhra coast and decays inland
Note the coast: Kakinada and Konaseema again, the districts Arnab crossed six days earlier, with 300 mm-plus on both over 1–3 November and gusts near 95 km/h. On saturated ground, the second event is the more dangerous one for the same rainfall.
🧊 Will It Actually Become a Cyclone? The First Storm Gets a Vote
Start with the simple version. A cyclone runs on warm water. It needs a sea surface near 26.5 °C or above, and it needs that warmth to extend some way down, not just sit as a thin skin on top — because the storm's own winds churn the upper ocean as it passes.
That churning is the whole point. A cyclone does not merely take heat off the sea; it stirs the sea, dragging cold water up from below and mixing it into the warm surface layer. What it leaves behind, along its own track, is a band of ocean 1 to 3 °C cooler than it was — a cold wake. The sun takes days, sometimes a couple of weeks, to put that heat back.
So the next storm does not get the ocean the first one found. If it follows roughly the same path soon afterwards, it is running over its predecessor's leftovers — cooler water, less fuel, and a lower ceiling on how strong it can get. A couple of degrees does not sound like much. Against a 26.5 °C threshold, it is most of the margin.
That is precisely the situation here. Arnab spent 25–27 October ploughing west along 13.5–15.5°N between 82°E and 90°E. Through 1 and 2 November the run takes the follower from 12.8°N 86.8°E to 14.4°N 83.1°E to 15.4°N 82.1°E — straight down the line Arnab took. And the modelled intensity has duly collapsed:
| Run | Peak central pressure | Peak wind | Where it lands |
|---|---|---|---|
| 00 UTC 27 Oct | 956 hPa | 160 km/h | West Bengal–Bangladesh, 31 Oct |
| 00 UTC 29 Oct | 984 hPa | 110 km/h | Coastal Andhra Pradesh, 2–3 Nov |
Twenty-eight hectopascals weaker, 50 km/h slower, about 800 km further south and two days later. That is the correction the cold-wake idea predicts, in the direction it predicts. Two caveats in fairness: a 28 hPa swing at four to five days is also just ordinary model volatility, and causation cannot be proved from a pressure field alone. But physics and revision point the same way — and because the model treats the sea surface as largely fixed, it is more likely to be under-penalising the follower than over-penalising it.
So — will it become a cyclone? The run still says yes, and Severe Cyclonic Storm strength on an already-battered coast is not a small thing. But the honest reading is a system with a ceiling on it: cyclone strength plausible, anything like Arnab unlikely, and further downgrades more likely than upgrades.
✅ What to Watch Now
- Kakinada to Konaseema: relief and restoration have a window of roughly three days, not a week. Plan the second event into it.
- The 30–31 October runs: once this system actually exists and is being tracked rather than predicted, the spread on intensity and landfall narrows fast.
- Saturated ground: what matters next is not the biggest rainfall number, it is the number falling on soil that cannot take any more.
🧭 The one idea to keep. A cyclone changes the ocean it crossed — it cools the water along its own path, for days. The next storm does not inherit the same Bay. And a forecast model that treats the sea as a fixed boundary will keep telling you the follower is stronger than it turns out to be.
Comments
⚠ Disclaimer
VayuMet's analysis is based on NOAA GFS model output and represents independent meteorological assessment. Before taking any decision based on weather forecasts, always consult your national official meteorological broadcaster for authoritative guidance.
Data Source: Observed rainfall: IMD 0.25° real-time gridded daily rainfall for 27 and 28 October 2026, read directly from the archive VayuMet maintains; district figures are area means and maxima over the 0.25° cells falling inside each district boundary, so they are not station readings · Forecast bars: the district means published in VayuMet's 27 October article, from NOAA GFS 00 UTC 27 Oct 2026 · Second system: NOAA GFS 00 UTC 29 Oct 2026; centre positions, central pressure and stage derived from the run's own mean sea level pressure and 10 m wind fields, placed on the standard IMD cyclone intensity scale · Damage, casualty, evacuation and crop figures are preliminary press and official statements collected from open sources on 28–29 October; they disagree with one another, are reported here as they stand, and will be revised. · The 1–3 November system is a single-run signal at three to five days for a storm that has not yet formed, and is published as a watch item only.