The Invisible Hand: What Steers Cyclone Arnab — and Why It Turns Right
🌀 It has an eye. The 04:30 UTC Himawari image shows a clean, round, warm centre punched through the cloud shield over the west-central Bay — the surest visual sign that a tropical system has got its act together. The VayuMet model puts core winds near 144 km/h, Very Severe Cyclonic Storm on the IMD scale, gusting to 174 km/h. And yet the interesting question this morning is not how strong Arnab is. It is who is holding it. 🧭
🛰️ An Eye You Can See From 36,000 Kilometres
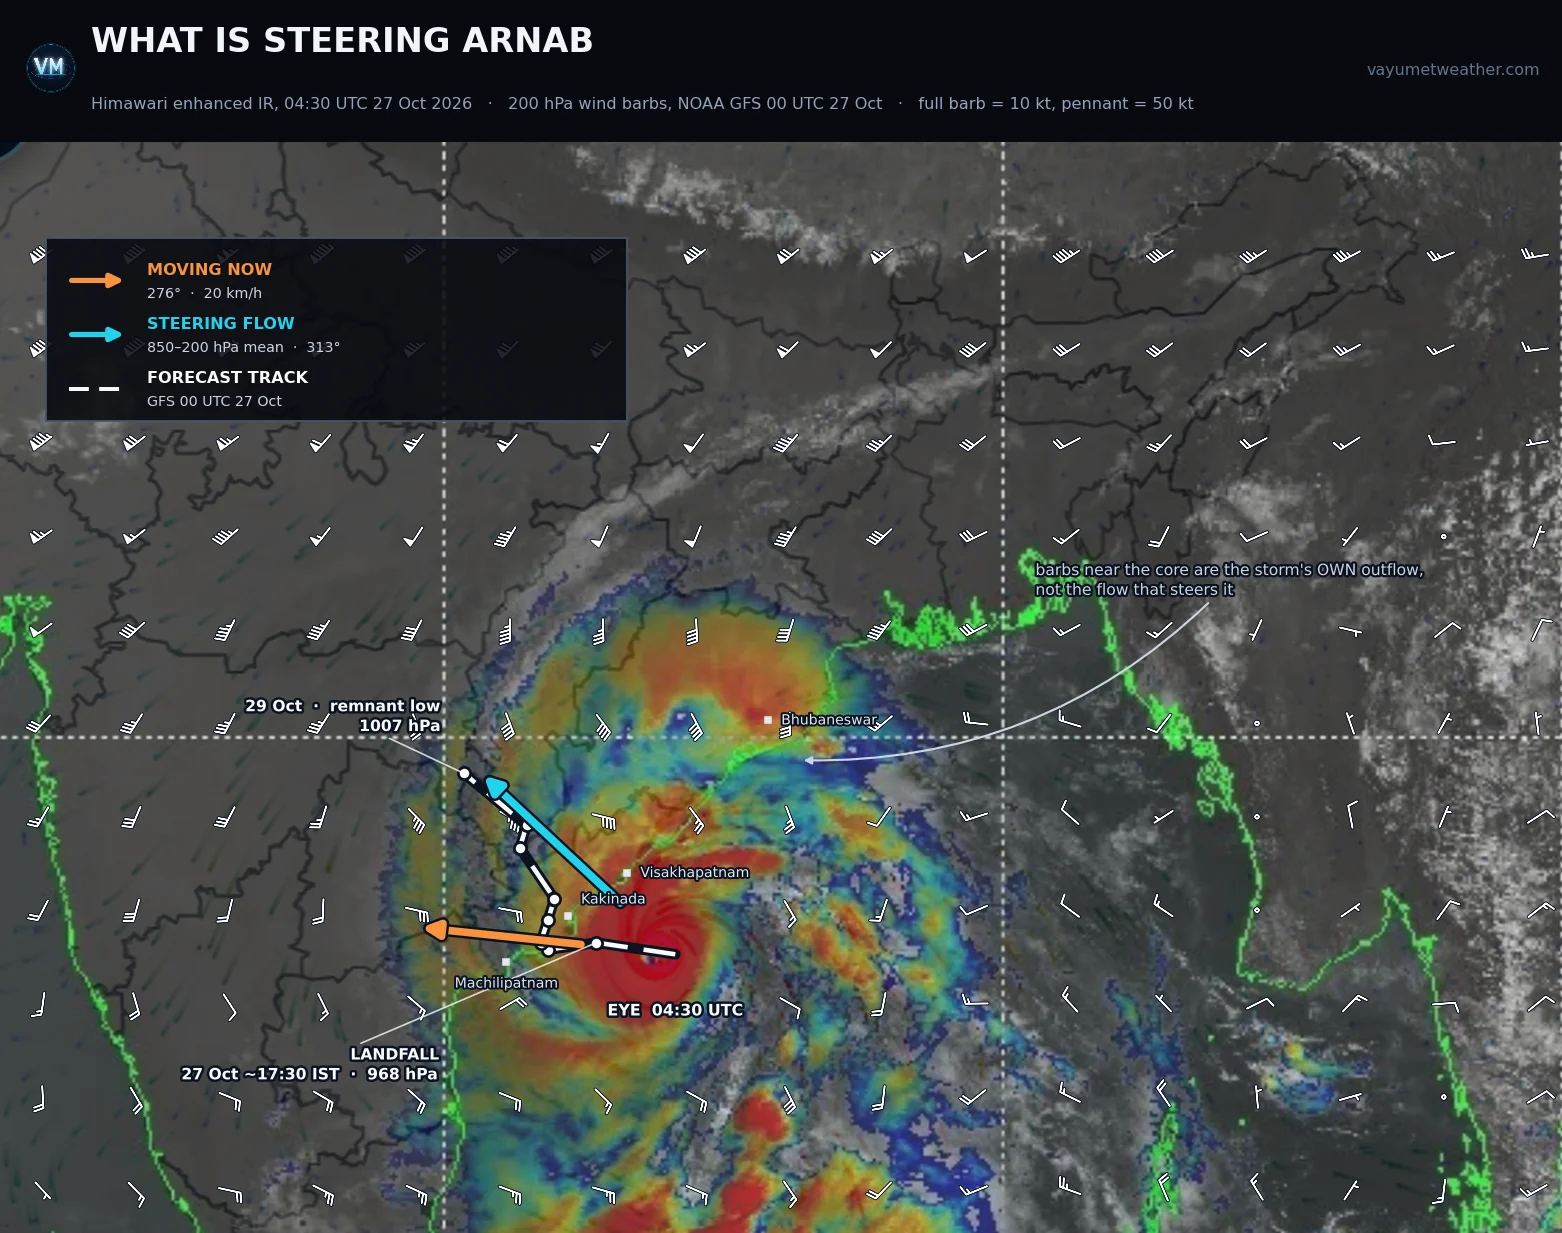
Himawari enhanced infrared, 04:30 UTC 27 Oct 2026, with 200 hPa wind barbs from NOAA GFS 00 UTC 27 Oct · full barb = 10 knots, pennant = 50 knots · barbs suppressed within about 190 km of the centre, and both vectors started clear of it, so the eye stays readable · orange = current motion, cyan = the 850–200 hPa steering flow, white dashes = the forecast track · the eye is small, round and tightly wrapped — a storm at or near its peak
🔴 Against the official picture. IMD has named the system Arnab and carries a red alert for Extremely Heavy Rain over parts of coastal Andhra Pradesh including Kakinada and Konaseema. The VayuMet model is one category stronger and about half a day quicker, bringing the centre ashore late on the 27th rather than the 28th. Treat the timing below as the aggressive end of the envelope; act on the IMD bulletin.
🧭 A Cyclone Does Not Drive. It Is Carried.
The spin of a cyclone has almost nothing to do with where it goes — the winds inside go round in circles and cancel out. What moves the system is the wind blowing through the slab of atmosphere it occupies: the steering current. Think of someone holding you by the hair. Thrash, shout, spin — you still go exactly where the hand takes you. The storm's fury decides how hard the arrival is, not which coast gets it. Two refinements turn that into a forecast:
- The grip depends on how tall the storm is. A shallow low-pressure area is pushed by low-level winds alone; a mature cyclone reaches 15 kilometres up, so what steers it is the mass-weighted mean wind through the whole 850–200 hPa layer. That is why systems so often change direction the moment they deepen or weaken.
- Read the environment, not the storm. The barbs on top of the centre fan outward in all directions — Arnab's own outflow, not the flow carrying it. The steering signal lives in the ring 300 to 800 kilometres out, which is where VayuMet computes it.
So why plot 200 hPa rather than the middle of the storm? Because that is where the turn shows up first. The ridge-and-trough pattern that reorganises the steering column announces itself at the top of the troposphere a good half-day before the deep-layer average swings round. Upper winds turn, steering turns, storm turns — that ordering is the forecast.
📐 The Turn, in Numbers
The two vectors on the image above, at six-hourly steps from the same run. Bearings are the direction of travel. Watch the third column rotate clockwise.
| Valid (UTC) | Storm motion | Steering flow, 850–200 hPa | 200 hPa flow |
|---|---|---|---|
| 27 Oct 06 | 276° · 20 km/h | 313° · 14 km/h | 352° |
| 27 Oct 12 | 262° · 16 km/h | 315° · 12 km/h | 342° |
| 27 Oct 18 | 314° · slow | 318° · 15 km/h | 336° |
| 28 Oct 06 | 017° · 7 km/h | 341° · 15 km/h | 338° |
| 28 Oct 18 | 017° · 7 km/h | 360° · 19 km/h | 351° |
| 29 Oct 00 | — | 008° · 19 km/h | 358° |
The steering vector swings from 313° to 008° in 42 hours — northwest round to just east of north — and the track follows a few hours behind. Nothing about the storm causes this. The subtropical ridge to the east builds poleward while a westerly trough digs in to the northwest, and the gap between them opens a channel pointing north. That is recurvature: not the storm deciding to turn, but the river bending.
One detail: the storm runs at 20 km/h against a 14 km/h steering flow, and slightly left of the steering bearing. That is beta drift, the poleward-and-westward nudge every northern-hemisphere cyclone gives itself because the Earth's rotation varies with latitude — invisible in a day, decisive over three.
🌊 Track, Landfall and the Severe Weather With It
Translated into a track: Arnab runs west-northwest through today, crosses the Kakinada–Konaseema coast late on 27 October near peak, then turns hard north and weakens fast over land — a remnant low near the Chhattisgarh–Vidarbha border by 29 October.
| Valid (UTC) | Position | Central pressure | Stage on the IMD scale |
|---|---|---|---|
| 27 Oct 06 | 16.4°N 83.9°E, offshore | 968 hPa | Very Severe Cyclonic Storm |
| 27 Oct 12 | 16.5°N 82.8°E, at the coast | 968 hPa | Very Severe Cyclonic Storm |
| 27 Oct 18 | 16.4°N 81.9°E, inland | 981 hPa | Weakening rapidly |
| 28 Oct 12 | 17.3°N 82.0°E | 997 hPa | Depression |
| 29 Oct 06 | 19.4°N 80.4°E | 1007 hPa | Remnant low |
The severe weather is not centred on the landfall point. Because the storm turns north almost at once, the heaviest rain piles up to the right of the track along the north Andhra and south Odisha coast, while the strongest gusts stay near the crossing. Totals and peak gusts, 27 Oct 06 to 28 Oct 12 UTC:
| District | Rainfall | Peak gust | IMD rain category |
|---|---|---|---|
| Srikakulam, Andhra Pradesh | 257 mm | 75 km/h | Extremely Heavy Rain |
| Vizianagaram, Andhra Pradesh | 248 mm | 78 km/h | Extremely Heavy Rain |
| Visakhapatnam, Andhra Pradesh | 238 mm | 73 km/h | Extremely Heavy Rain |
| Gajapati, Odisha | 228 mm | 59 km/h | Extremely Heavy Rain |
| Parvathipuram Manyam, Andhra Pradesh | 191 mm | 55 km/h | Very Heavy Rain |
| Anakapalli, Andhra Pradesh | 177 mm | 85 km/h | Very Heavy Rain |
| Ganjam, Odisha | 170 mm | 58 km/h | Very Heavy Rain |
| West Godavari, Andhra Pradesh | 163 mm | 103 km/h | Very Heavy Rain |
| Kakinada, Andhra Pradesh | 111 mm | 106 km/h | Heavy Rain |
Three hazards sit above the rainfall: gale-force gusts of 100–106 km/h over Kakinada and West Godavari at the crossing; storm surge on the shallow Godavari delta shelf, worst right of track between Kakinada and Yanam; and landslides rather than slow flooding in the Eastern Ghats, where 200 mm-plus lands on steep ground.
🌧️ The Rain Goes a Very Long Way Past the Coast
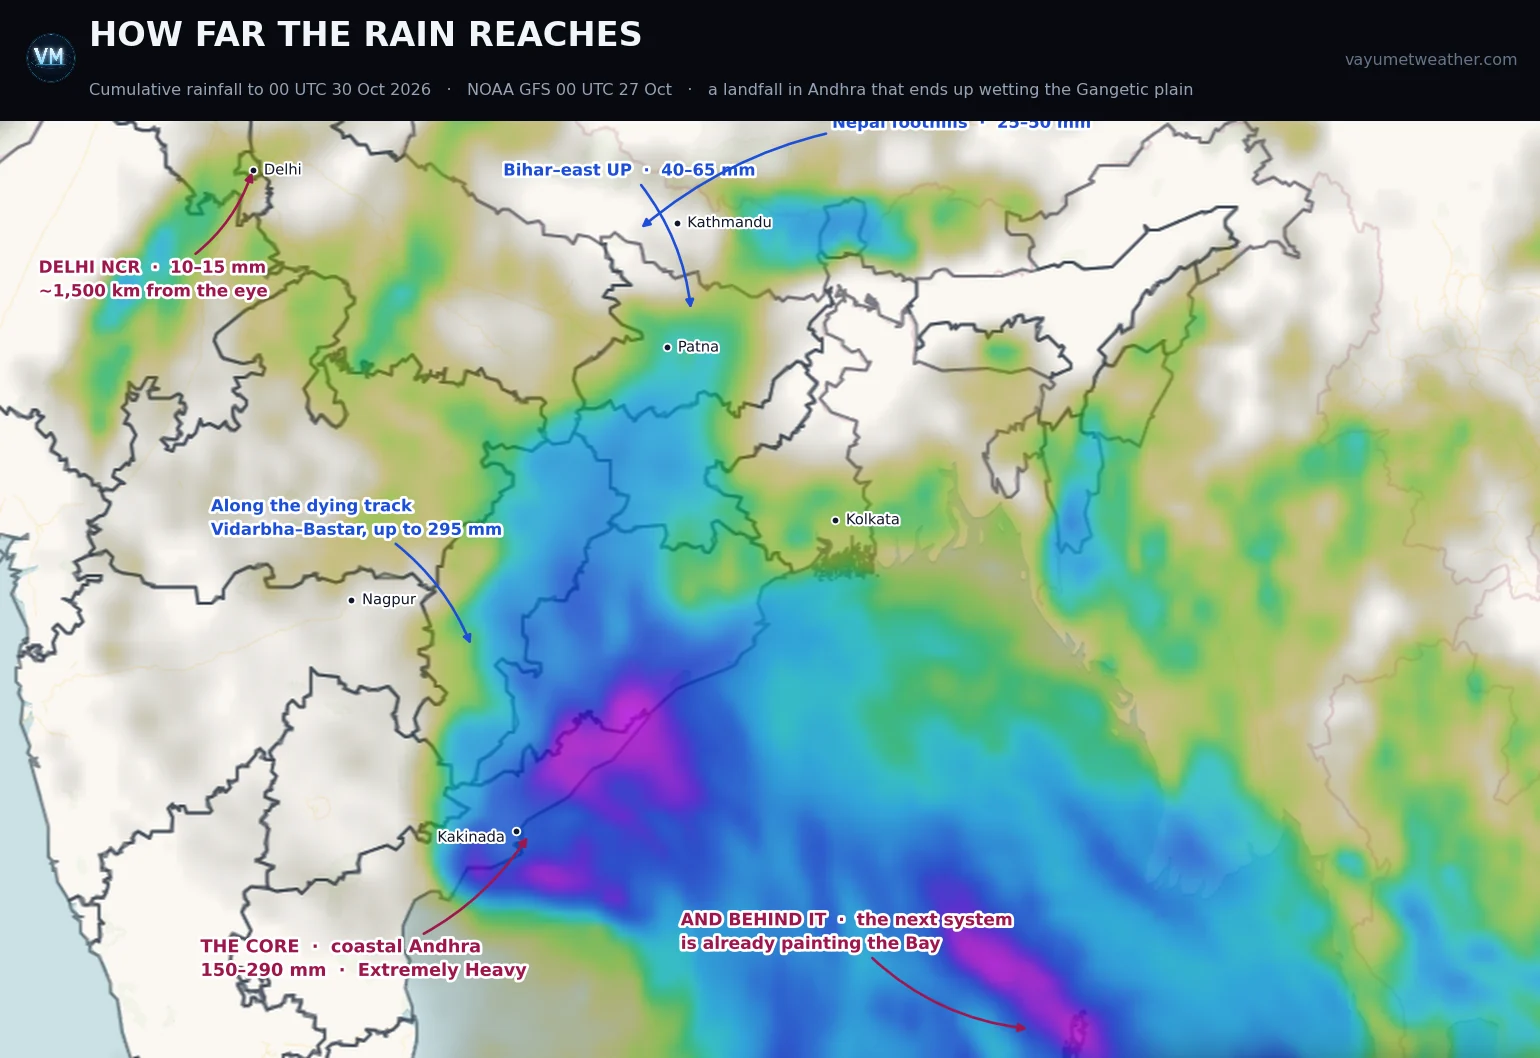
Cumulative rainfall to 00 UTC 30 Oct 2026 · VayuMet, NOAA GFS 00 UTC 27 Oct 2026 · forecast, not an observation
This is the part a landfall map never shows. When Arnab's circulation collapses its moisture does not collapse with it — the westerly flow takes it northwest, then north. To 00 UTC on 30 October: 150–290 mm over coastal Andhra, up to 295 mm along the dying track through Bastar and Vidarbha, 40–65 mm across Bihar and east Uttar Pradesh, 25–50 mm in the Nepal foothills — and still 10–15 mm over Delhi NCR, some 1,500 kilometres from this morning's eye.
Ten millimetres is not a warning; it is a demonstration. A storm that comes ashore in Andhra on a Tuesday evening measurably wets the capital by Friday — the best argument there is for reading a cyclone as a continental event, not a coastal one.
👀 And Behind It — Don't Put the Charts Away
The magenta streak at the bottom right of the rainfall map is not Arnab. The same run spins up a second system over the Andaman Sea around 29 October. These are the run's numbers, not a forecast of stage — read the next two paragraphs before taking any of them seriously:
- 29 Oct — a low near 12.4°N 93.6°E, 1002 hPa in the run
- 30 Oct — 989 hPa over the central Bay
- 31 Oct — 956 hPa and winds near 160 km/h near 20.5°N 89.0°E
- 31 Oct night – 1 Nov — onto the West Bengal–Bangladesh coast around the Sundarbans
Treat that intensity with real scepticism, for a physical reason. A cyclone does not simply take heat out of the ocean, it stirs it — the wind field mixes cool water up from below and leaves a cold wake along and to the right of its track, typically 1–3 °C and lasting days. Arnab has spent 25–27 October ploughing west along 13.5–15.5°N between 82°E and 90°E, and the follower's modelled track crosses that band near 15–17°N, 90–91°E on 30 October. Cyclones need roughly 26.5 °C through a deep enough layer — a couple of degrees is the whole margin.
And the model cannot really penalise that: it runs on a largely prescribed sea surface, so it does not reproduce the cooling the first storm leaves for the second, and a follower is routinely forecast too strong. In fairness the deepest part of Arnab's wake, under its Very Severe phase between 82°E and 87°E, sits southwest of the follower's path — a dampener, not a veto. But 956 hPa is the top of the range, and a system that never reaches cyclone strength at all is entirely plausible. Add the usual caution — one run, five days out, for a storm that does not yet exist — and this is not something to act on. It is only a reason not to stand the machinery down on 29 October. 👀
✅ What That Means Today
- Kakinada to Yanam: the next 12 hours are the event. Be where you will spend the night before dark — and a lull means the eye, not the end.
- Srikakulam to Ganjam: the peak is the rain, and it arrives after the crossing. Fishermen off the west-central and northwest Bay until the system is inland.
- Everyone: follow the IMD bulletin and your SDMA. Model guidance sets posture; only the official warning sets action.
🧭 The one idea to keep. To know where the next system will go, don't ask how strong it is — ask what the flow above it is doing. Intensity tells you what arrival feels like. Steering tells you whose coast it is.
Comments
⚠ Disclaimer
VayuMet's analysis is based on NOAA GFS model output and represents independent meteorological assessment. Before taking any decision based on weather forecasts, always consult your national official meteorological broadcaster for authoritative guidance.
Data Source: NOAA GFS 00 UTC 27 Oct 2026 · Satellite image: Himawari enhanced infrared, 04:30 UTC 27 Oct 2026, as rendered on the VayuMet map; the wind barbs were registered to it using the two graticules visible in the frame · The steering flow is computed inside VayuMet as the mass-weighted mean wind through the 850, 500, 300 and 200 hPa levels, averaged over a ring 3° to 7° of latitude from the centre, so that the storm's own circulation and outflow are excluded · Storm motion is the centre-to-centre displacement between consecutive six-hourly steps of the same run · Centre positions, central pressure and stage derived from the run's own mean sea level pressure and 10 m wind fields, placed on the standard IMD cyclone intensity scale · District rainfall and gusts: VayuMet district warning system, IMD rainfall categories · The 29 October–1 November system is a single-run signal at four to five days for a storm that has not yet formed, and is published as a watch item only. Its modelled intensity should be read as an upper bound: the model's sea surface is largely prescribed, so the cooling Arnab leaves behind in the Bay is not fully represented and a following system is systematically forecast too strong.