The Smoke Arrived on Schedule. Diwali Lands in Air With Nowhere to Go.
For most of October, rain did what no policy has managed. Three good spells over Delhi, on 12, 16 and 30 October, washed particulate out of the air, wetted the fields of Punjab and Haryana so they could not be burnt, and kept the sky over the plain clearer than this season usually allows. Since 1 November it has not rained at all, and the air has turned. ECMWF CAMS, as carried in VayuMet's air-quality module, has Delhi's daily PM2.5 nearly doubling in four days, from 84 µg/m³ on 1 November to 158 µg/m³ on 5 November. Diwali falls on 8 November. The VayuMet model gives the festival night a breeze that helps, but not enough, and lighter winds return from 10 to 14 November, just when the fireworks smoke and the stubble smoke need to leave.
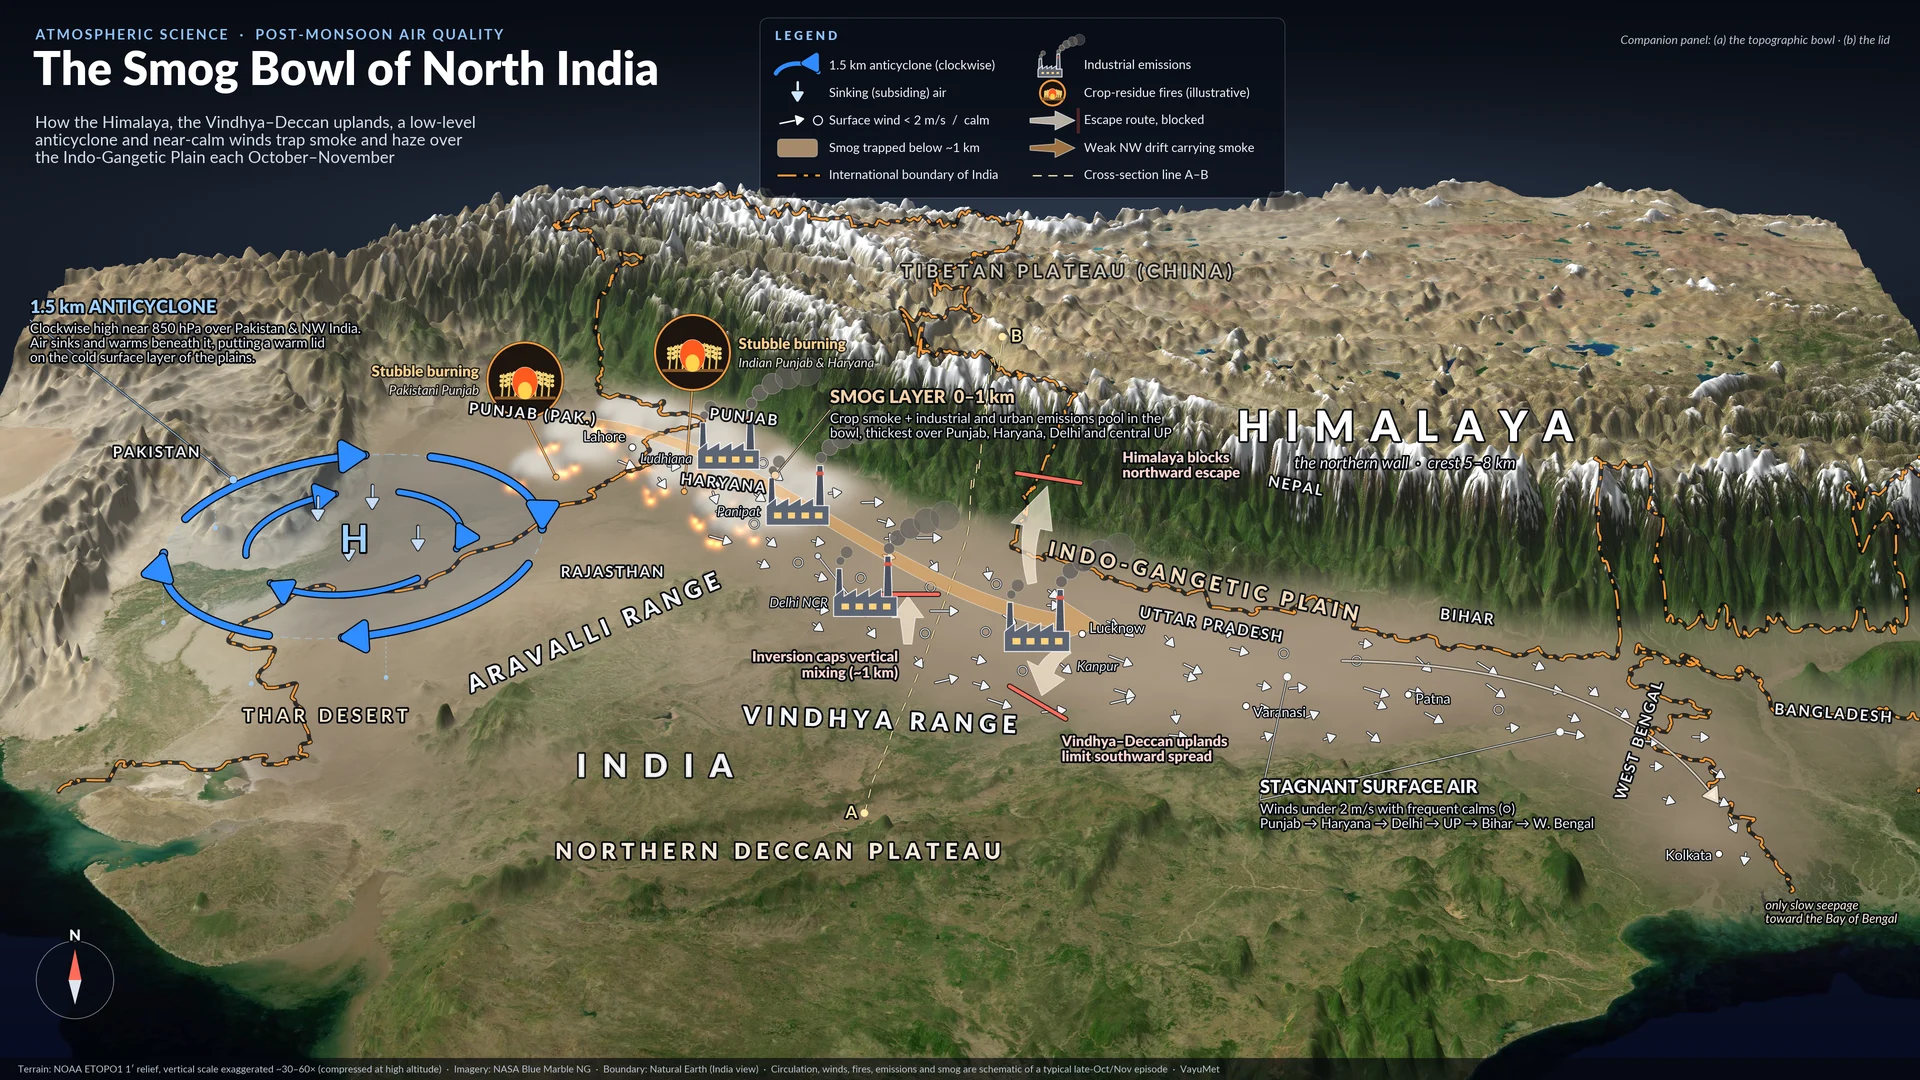
The smog bowl of north India · NOAA ETOPO1 relief, vertical scale exaggerated · circulation, fires, emissions and smog are schematic of a typical late-October/November episode · VayuMet
The short version. Even with October's rain, Delhi's air was above India's 24-hour PM10 standard (100 µg/m³) on 35 of the 37 days since 1 October, and above the PM2.5 standard (60 µg/m³) on 33. Now the rain has stopped and the smoke has arrived. Diwali night looks breezy in the model, but the days after it do not, and that is where the risk of a multi-day Severe episode sits.
Two Pollutants, One Season: PM2.5 and PM10 Over Delhi
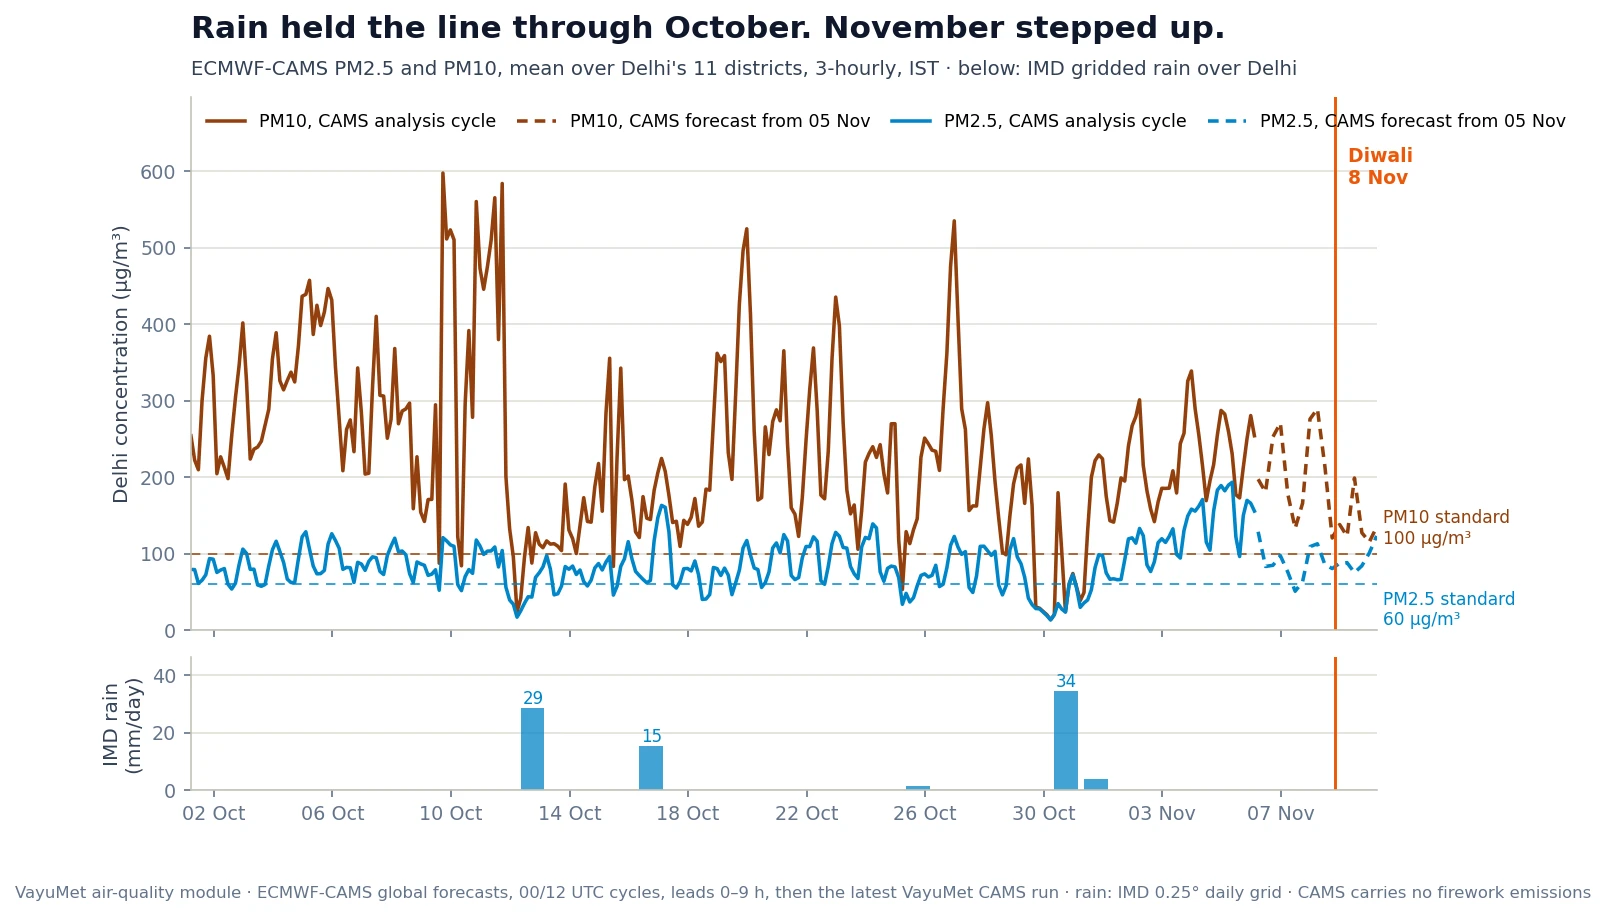
ECMWF CAMS PM2.5 and PM10, mean over Delhi's 11 districts, 3-hourly, IST · solid: 00/12 UTC analysis cycles · dashed: VayuMet's CAMS run of 5 Nov 00 UTC · lower panel: IMD 0.25° gridded daily rain over Delhi
Rain is the reset button. Line the two panels up and every clean spell in October sits under a rain bar. After 29 mm on 12 October, Delhi's daily PM10 fell from 412 to 90 µg/m³ and PM2.5 to 43 µg/m³. After 34 mm on 30 October they reached the season's lowest, 62 and 34 µg/m³. Rain scrubs particles straight out of the air, and the wind that comes with a western disturbance flushes the plain. Between the rain spells the air rebuilt itself within days.
PM10 is the year-round problem. PM10 means particles up to 10 micrometres across. Over Delhi it is dominated by sources that run every day of the year: dust thrown back into the air by traffic, construction and demolition, industrial and power-plant emissions, and vehicle exhaust. In the first week of October, before any smoke season, Delhi's daily PM10 already ran between 270 and 425 µg/m³, three to four times the standard. That is the baseline that cities, industry and transport create on their own.
PM2.5 tells you when the smoke arrives. PM2.5, the fine fraction under 2.5 micrometres, comes mostly from combustion: vehicle and industrial exhaust, and biomass and crop-residue fires. In early October it was only about a quarter to a third of the PM10 total. By 4–5 November it was two-thirds of it, with PM2.5 at 155–158 µg/m³. The total did not change much; what it was made of did. CAMS's aerosol split says the same thing: the non-dust share of the haze over NCR has risen from about 63% in early October to 87% on every day from 2 to 5 November, while the dust part stayed flat. The delayed stubble burning has started, and the rain is no longer there to stop it.
Cause 1 — Meteorology: the Bowl and the Lid
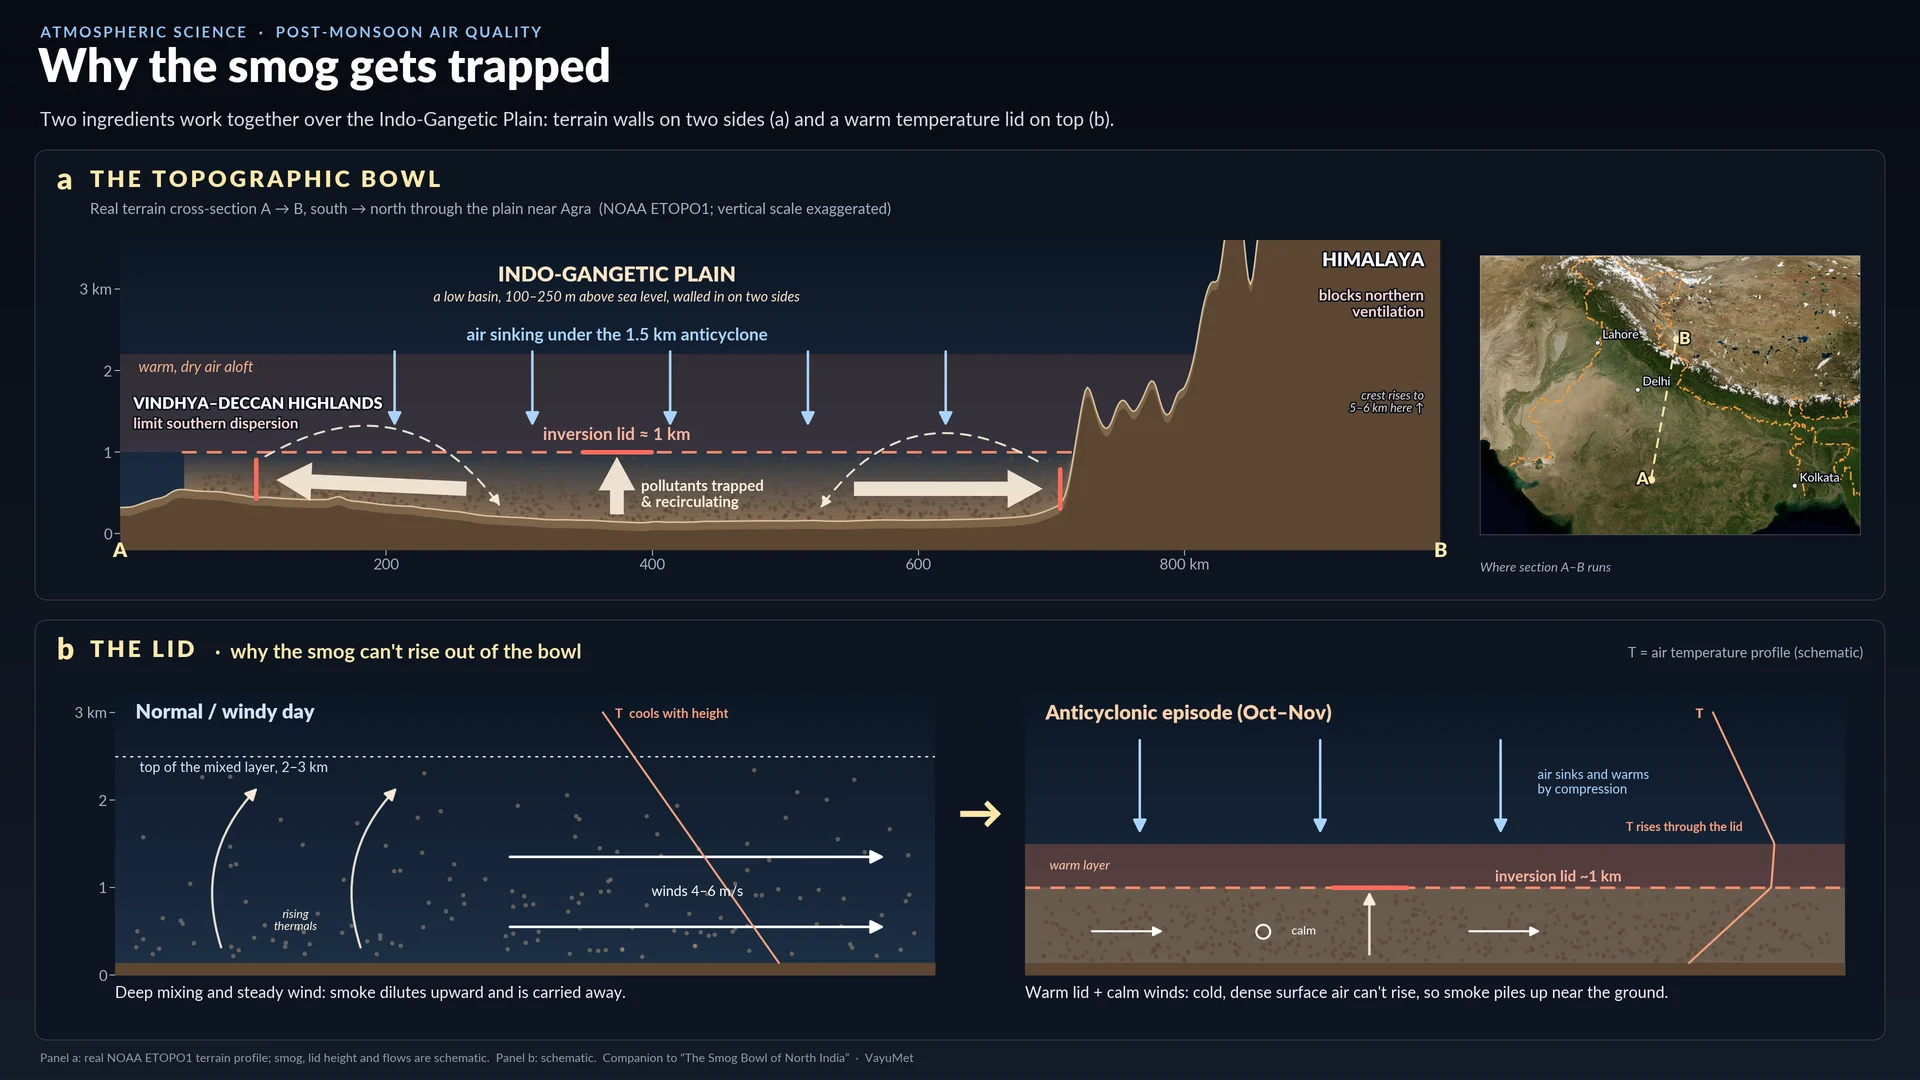
Why the smog gets trapped · panel a: NOAA ETOPO1 terrain profile, smog and lid schematic · panel b: schematic · VayuMet
None of the emissions below would matter half as much anywhere else in India. Four meteorological ingredients line up over the plain every October–November:
- The bowl. The plain is 100–250 m above sea level, walled by the Himalaya to the north and the Vindhya–Deccan uplands to the south. Air that would flush it out is blocked at both ends.
- The lid. A low-level anticyclone near 850 hPa (about 1.5 km) over Pakistan and northwest India pushes air downward. Sinking air warms by compression and sits on top of the cold surface layer as a temperature inversion near 1 km. Smoke cannot rise through it.
- The calm. Below that lid, surface winds drop under 2 m/s (7 km/h) for long stretches. Without wind there is no sideways escape either.
- No rain. Post-monsoon rain is rare. When a western disturbance does bring it, as it did three times this October, the air clears within a day. When it stays dry, as it has since 1 November, nothing removes the particles but the wind.
Long, clear nights then cool the ground fast and squeeze the mixing layer down to a few hundred metres. The same emissions are packed into a far smaller volume, which is why NCR's worst hours are almost always just before dawn.
Cause 2 — Human-Made: the Floor and the Spikes
Meteorology decides how much of what is emitted stays. People decide what is emitted.
- Industry and vehicles: the floor. Vehicle exhaust, road dust churned up by traffic, construction and demolition, industrial units, brick kilns and coal-fired power. Together they keep PM10 above its standard almost every day of the year and hold a PM2.5 baseline of roughly 60–100 µg/m³ under everything else. This is the largest single block, and the one that never switches off.
- Crop residue burning: the seasonal spike. Paddy stubble burnt in Punjab and Haryana to clear fields for wheat. In peak weeks it is commonly put at 50–75% extra PM2.5 over Delhi. This year October's rain delayed it; the late harvest now squeezes the burning into fewer days.
- Local burning. Municipal waste and biomass burnt for heat across NCR: small fires that add up over a dense population.
- Festival fireworks: the one-night spike. A few hours of very intense, very local emission, covered next.
Source shares are published source-apportionment ranges for the Oct–Dec season, not VayuMet model output.
Cause 3 — Diwali: How the Festival Night Fits In
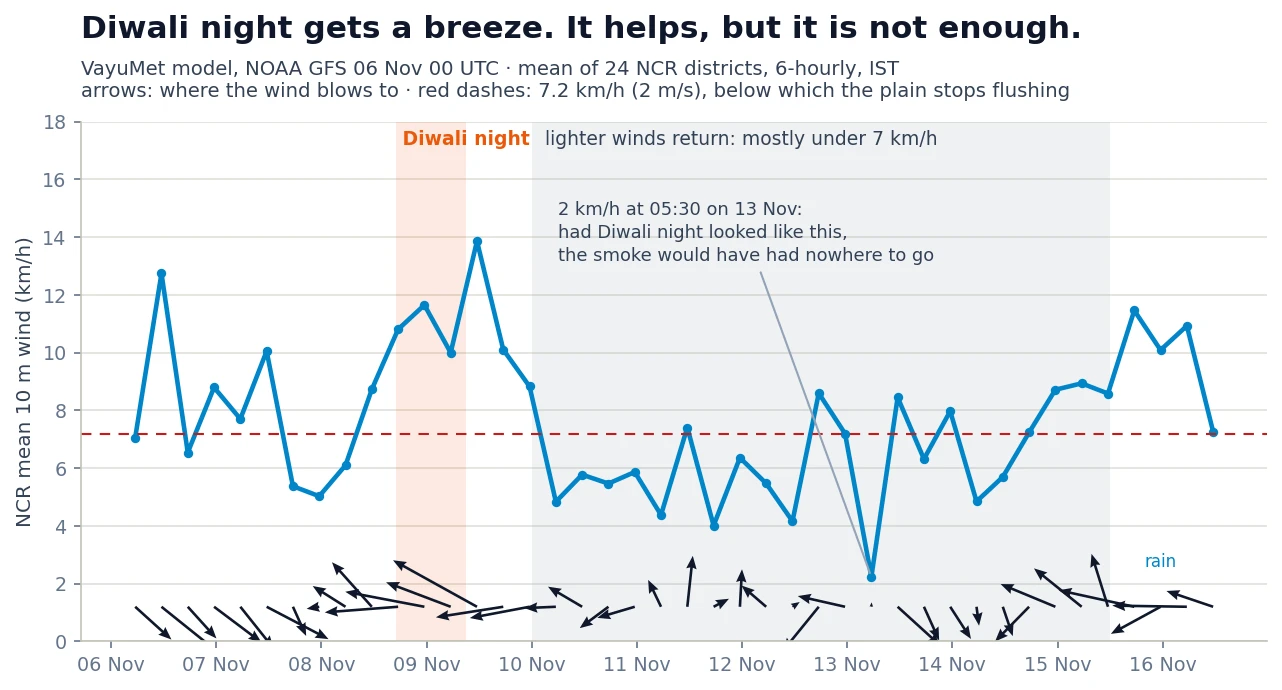
VayuMet model, NOAA GFS 00 UTC 6 Nov 2026 · 10 m wind averaged over 24 NCR districts, 6-hourly, IST · arrows point where the wind blows to
The awkward fact about every Diwali air-quality forecast is that the forecast model does not know it is Diwali. ECMWF CAMS uses emission inventories without a festival firework spike. So its values for Diwali night, about 87 µg/m³ PM2.5 and 138 µg/m³ PM10 for Delhi at 23:30 IST, describe the air the fireworks will be set off into, not the air after them. To get a realistic number you have to add the festival back in yourself, in three steps.
1. Take the model's baseline. CAMS's Diwali-night values are lower than the days either side because the model brings in a breeze.
2. Scale it by what Diwali added last year. In 2025, analysis of CPCB station data put Delhi's PM2.5 at about 488 µg/m³ averaged over the 24 hours after Diwali, against 157 µg/m³ before it. That is roughly three times higher, in a year when stubble fires were reported 77% down. Most of the jump was the fireworks and the still night they were burnt into.
3. Correct for this year's weather. The breeze is the one piece of good news. The VayuMet model has NCR's 10 m wind at 10–13 km/h from the east and southeast through Diwali night and into the morning of 9 November. That mixes and carries off part of the smoke, and the easterly also cuts off smoke drifting in from Punjab for those hours. It helps, but it is not enough. A breeze of 10–13 km/h dilutes a night of fireworks; it does not clear it, and with no rain in the run nothing washes the particles out. Relative humidity also climbs from about 30% to 55% by dawn on 9 November, and damp air helps fine particles swell into haze.
It could have been much worse. On the morning of 13 November the same model run has the NCR-mean wind down to about 2 km/h. Had Diwali night looked like that, the smoke would have had nowhere to go, and a threefold jump on an already elevated baseline would have sat over the region for days. Instead, the lighter winds arrive on 10 November. From then to 14 November the wind is mostly under 7 km/h, and whatever the festival leaves behind, plus a week of stubble smoke, settles under the lid.
Our reading, in one line. Diwali night is likely to be bad but partly ventilated. The longer exposure window is 10–14 November, when the post-festival load meets light winds and no rain. Expect pre-dawn station readings well above anything CAMS prints, and treat the CAMS values in this article as a regional floor, not a forecast for any one station. A light western-disturbance spell around 15–16 November is the first sign of relief in the run. If sustained, it would bring isolated light rain and a stronger wind to flush the plain.
Cause 4 — Mitigation: What Actually Moves the Number
If meteorology sets the size of the bowl, mitigation is about putting less into it, and timing what goes in against the weather.
- Lower the floor: industry and transport. Enforce emission norms on industrial units and brick kilns, shift freight and buses to cleaner fuels, control dust on roads and construction sites, and stop waste burning. Because PM10 breaks its standard almost every day, these year-round cuts move the number more than any one-season measure.
- Time actions to the weather, not the calendar. Measures under the Graded Response Action Plan (GRAP), such as construction pauses, truck-entry limits and hot-mix plant shutdowns, do the most good before a still spell. In this run that means having them in place by 9–10 November, not after the AQI has already crossed into Severe.
- Stubble alternatives at scale. In-situ machinery such as Happy Seeder and Super Seeder, bio-decomposer sprays, and ex-situ use of straw in biomass power and pellets. A late harvest is the strongest argument for pre-positioned machines: when the window is ten days instead of thirty, farmers burn what they cannot clear.
- On the night. Fewer and shorter fireworks, and community displays instead of house-by-house bursting. The same smoke released over two hours instead of six disperses better on a breezy night like this one.
- Protect people while it is bad. N95/FFP2 masks outdoors, indoor air cleaning, and moving outdoor school sport and morning exercise out of the 10–14 November dawn hours, when concentrations peak.
- Read the forecast as a decision tool. The VayuMet air-quality layers show PM2.5, PM10, total and dust aerosol optical depth and visibility out to five days, next to the wind and rain fields that decide whether the plain flushes. Together they tell you which days to act.
Why it matters. The World Health Organization's 24-hour guidelines are 15 µg/m³ for PM2.5 and 45 µg/m³ for PM10. Delhi's CAMS background is running at several times both before a single Diwali firework is lit. The season is not caused by one festival or one state's fields. It is a basin with a lid on it, filled every day by industry and traffic and topped up by smoke, and in most years only the rain empties it.
Comments
⚠ Disclaimer
VayuMet's analysis is based on NOAA GFS and ECMWF CAMS model output and represents independent meteorological assessment. Before taking any decision based on weather or air-quality forecasts, always consult your national official meteorological broadcaster and the Central Pollution Control Board for authoritative guidance.
Data Source: Air quality: ECMWF CAMS global forecasts as carried in VayuMet's air-quality module · PM2.5 and PM10 series from the 00/12 UTC cycles (leads 0–9 h), 1 Oct – 5 Nov 2026, then the run of 5 Nov 2026 00 UTC · CAMS contains no festival firework emissions · Rain: IMD 0.25° gridded daily rainfall · Wind: NOAA GFS 00 UTC 6 Nov 2026, VayuMet district meteograms · Diwali 2025 station figures: CPCB data as reported in the press · Source-apportionment ranges are published literature, not VayuMet output · Terrain illustrations: NOAA ETOPO1, schematic overlays by VayuMet · Model guidance only — verify against CPCB and IMD bulletins.