Wind Speed Is Not Wind Power — Forecasting India's Solar and Wind Resource Day by Day
A wind forecast of 30 km/h and one of 54 km/h look like the same kind of day — breezy, then breezier. To a turbine they are not remotely alike. The energy carried by moving air rises with the cube of its speed, so the second wind delivers nearly six times the power of the first. Solar has its own version of the trap: the sunlight reaching the ground is not what a panel produces, because the same heat that comes with strong sun strips output back down. Grid operators schedule against the day ahead, not against annual averages, and this article explains what the resource quantities actually mean, how VayuMet computes them for every district, what the ten-day energy meteogram shows — and where a resource forecast stops being a generation forecast.
The one relationship to hold onto. Wind power density is ½ ρ v³. Double the wind speed and the available power rises eightfold. That amplification is why wind is so valuable when it blows — and why a modest error in the wind forecast becomes a large error in the power forecast.
What the Wind Resource Actually Is
Speed at the height that matters
Surface wind at 10 m is what weather reports quote, and it is the wrong height for a modern turbine. VayuMet forecasts wind at 100 m, a typical utility-scale hub height, where flow is stronger and less disturbed by terrain and buildings. A turbine then only works inside a band:
| 100 m wind | Turbine state | What it means operationally |
|---|---|---|
| below 12.6 km/h | NO POWER | Below cut-in — the rotor does not generate. A full day here is a wind lull. |
| 12.6–46.8 km/h | RAMP-UP | Output climbs steeply with speed — the cube law at work, and the most forecast-sensitive range. |
| 46.8–90 km/h | FULL POWER | Rated output. Extra speed adds nothing; the machine is capped. |
| 90 km/h and above | STORM CUT-OUT | The turbine shuts down to protect itself. Output drops to zero, often abruptly. |
Two of those rows are scheduling hazards rather than simply low output. A wind that rises through the cut-out threshold takes generation from maximum to nothing in a single step — a ramp event that a grid has to cover from somewhere else. And the ramp-up band is where forecast error costs the most, because a small shift in speed is a large shift in power.
Power density, and why air density matters
Air density ρ is usually treated as a constant, and it is not. Warm air and high ground are both thinner, so the same wind speed carries less energy on a hot afternoon, or on an upland site, than on a cool coastal morning. VayuMet computes ρ from forecast surface pressure and temperature at every step rather than assuming a standard atmosphere.
What the Solar Resource Actually Is
Global horizontal irradiance (GHI) is the total solar power arriving on a flat surface, in W/m². It is the headline solar quantity and it is highly volatile — a day of thick cloud can cut it by an order of magnitude against a clear day a few days either side.
But GHI is not panel output. Photovoltaic cells lose efficiency as they heat, and a panel in strong sun runs far hotter than the air around it. VayuMet estimates cell temperature from air temperature and irradiance, then derates:
That is roughly a half-percent loss for every degree the cell runs above 25°C. The penalty is largest exactly when irradiance is highest, which is why strong-sun hours in the hot season deliver less than their GHI suggests. Sunshine duration — hours of bright sun in each six-hour step — is carried alongside as a simpler check on how broken the cloud is.
What You Actually Get: The 10-Day Energy Meteogram
For any district, the Renewable Energy tab stacks the resource over ten days — solar, cloud by layer, 100 m wind against the turbine bands, and wind power density with air density and temperature alongside — refreshed every model run.
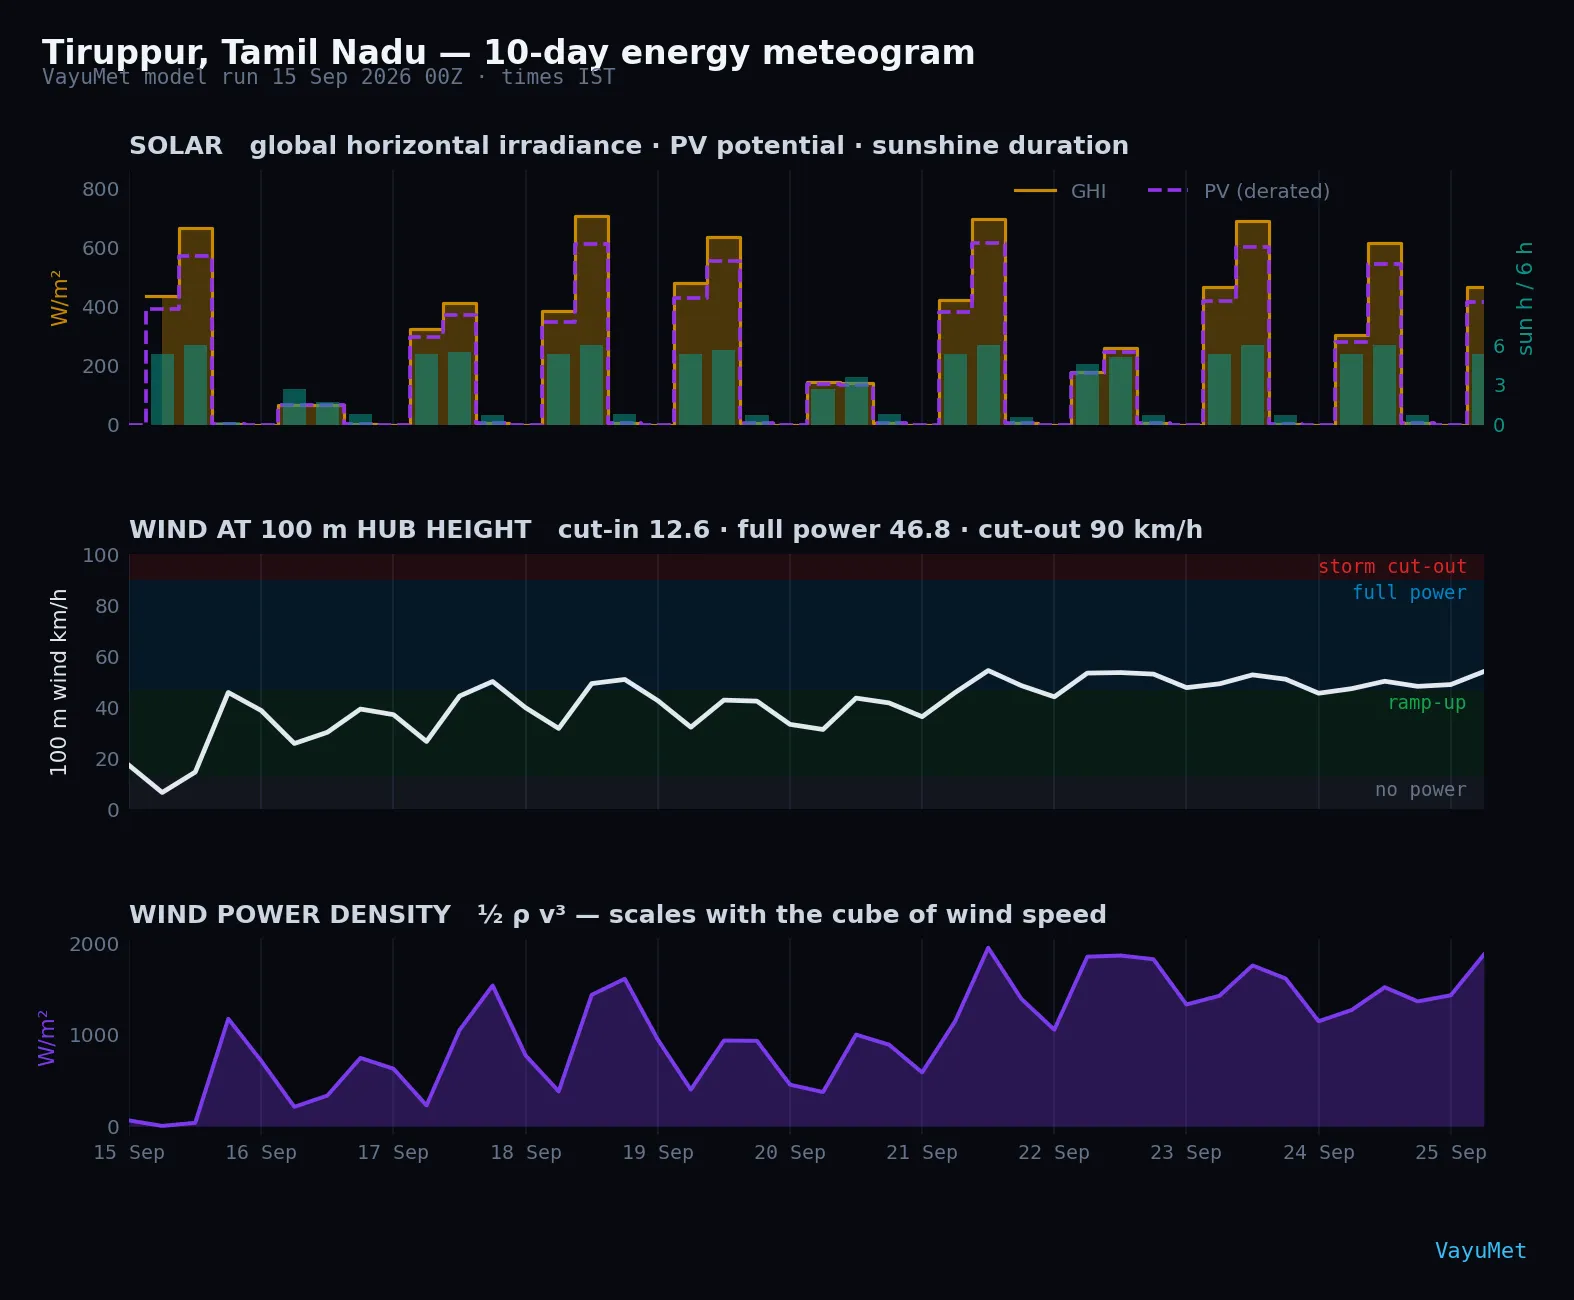
The bottom panel is the cube law made visible. Across this run, a 30 km/h wind carries about 335 W/m²; a 54 km/h wind carries about 1,950. Wind speed rises 1.8 times; available power rises 5.8 times. At the solar peak on 18 September, temperature derating takes GHI of 709 W/m² down to 615 — a 13% loss on the brightest hour of the run.
Beneath the chart, the advisory converts the panels into dated calls:
- Sustained wind generation — days with twelve or more hours inside the full-power band.
- Storm cut-out risk — any step with 100 m wind at or above 90 km/h, with the warning that shutdowns and steep ramps are likely.
- Wind lull — days that never reach cut-in speed.
- Reduced PV yield — days with solar energy below 55% of the period's best day, flagged as the natural window for solar-plant maintenance.
- Strong solar days — above 85% of the period's best, and cell-temperature derating on days reaching 40°C.
The maintenance call is the quietly useful one. Taking a solar plant offline on a day that was going to produce little anyway costs almost nothing; doing it on a strong day costs a full day of output.
How VayuMet Computes It
| Quantity | Source | Unit |
|---|---|---|
| Global horizontal irradiance | DSWRF — surface downward shortwave | W/m² |
| Sunshine duration | SUNSD — per 6-hour step | hours |
| Hub-height wind | 100 m u/v wind components | km/h |
| Air density | surface pressure ÷ (287.05 × T) | kg/m³ |
| Wind power density | ½ ρ v³ at 100 m | W/m² |
| PV potential | GHI, temperature-derated | W/m² |
All fields come from the VayuMet model at 0.25°, four runs daily, resolved to district polygons out to ten forecast days. The same wind and irradiance fields drive the Renewable Energy map layers.
Where Resource Stops Being Generation
- The cube law cuts both ways. A 10% error in forecast wind speed becomes roughly a 33% error in available power. Read power density as a strong indication of which days matter, not as a megawatt figure.
- These are resource fields, not plant output. Power density is the energy in the wind, not what a specific turbine converts; PV potential is derated irradiance on a flat surface, not a plant's generation. Neither knows about panel tilt, trackers, inverter limits, wake losses or availability.
- The turbine bands are generic. Cut-in, rated and cut-out speeds vary by machine. The 12.6, 46.8 and 90 km/h thresholds are representative of utility-scale turbines, not a particular model's power curve.
- Dust and haze are not in the PV estimate. Aerosol loading dims surface irradiance and soils panels — see the air quality explainer — and neither effect is subtracted here.
- There is no direct normal irradiance yet. GHI serves fixed photovoltaic plants well; concentrating solar and tracking systems depend on the direct beam, which is not currently forecast.
- 25 km smooths terrain. Wind corridors are shaped by gaps and ridgelines at scales finer than the grid. A district value does not capture the channelling that makes one hilltop far better than the next.
Open any district's energy meteogram on the District 10-Day Forecast, and switch to the Renewable Energy tab.
Open the District Forecast →