Rain Is the Wrong Number for Sowing — What Soil Moisture and Evaporative Demand Actually Say
It rained 30 mm yesterday. Is the field ready to sow? The rain gauge cannot answer that. Thirty millimetres onto a cracked, hot seedbed at the end of a dry spell may wet the top two centimetres and be gone by afternoon. The same 30 mm onto soil already near field capacity may waterlog the seed zone and rot the seed. The decision does not live in the rainfall total — it lives a few centimetres below the surface, where moisture, soil temperature and evaporative demand interact. This article sets out the quantities that actually govern a sowing window, the thresholds VayuMet applies, and where a district-scale forecast stops being a substitute for standing in the field.
The seed zone is the unit of decision. Germination depends on the top 0–10 cm holding enough plant-available water, at a temperature the seed responds to, for long enough to get through emergence — and on no washout downpour arriving in the meantime. Each of those is a separate forecast quantity.
The Sowing Rule, Stated
VayuMet classifies every forecast step into one of three sowing states. The rule is explicit rather than editorial, and it requires three conditions to hold at once — moisture, temperature, and the absence of a washout:
| Class | Seed-zone moisture | Soil temperature | Washout guard |
|---|---|---|---|
| SUITABLE | ≥ 0.18 vol or ≥ 20 mm rain in 72 h |
18–35 °C | no 6-h rain > 25 mm |
| MARGINAL | ≥ 0.12 vol or ≥ 8 mm rain in 72 h |
15–38 °C | no 6-h rain > 50 mm |
| UNSUITABLE | Any of the above conditions unmet | ||
Three things are worth drawing out. Moisture is volumetric — 0.18 means 18% of the soil volume is plant-available water, not 18 mm of rain. Incoming rain can substitute for stored moisture, which is why the rule accepts either a wet seedbed now or a credible 72-hour rainfall total. And the temperature band is two-sided: too cold and germination stalls, too hot and the seedbed dries faster than the radicle can establish.
The Water Balance: Demand, Not Just Supply
Rainfall is supply. The other half of the equation is demand — how fast the atmosphere is pulling water back out of the soil and the crop. That quantity is reference evapotranspiration (ETo), and VayuMet computes it by the FAO-56 Penman–Monteith method, the international reference standard:
What goes into ETo
Daily maximum and minimum temperature, mean relative humidity, 10 m wind adjusted to the 2 m reference height, and incoming solar radiation — combined with latitude, day of year and station elevation to derive extraterrestrial radiation, net shortwave and net longwave. The daily total is then distributed across 6-hourly steps weighted by solar irradiance, so demand peaks in the afternoon rather than being smeared flat across the day.
Comparing accumulated rainfall against accumulated ETo over the forecast period gives a simple, legible water-balance call:
This is the number that makes a dry spell legible before it becomes visible in the crop. A week with no rain and low demand is very different from a week with no rain and high demand, and only the second is an irrigation emergency.
Two Other Calls the Same Data Supports
The spray window
Pesticide and foliar application has a narrow meteorological window, and missing it wastes the input or moves it somewhere it should not go. The classification marks a step poor when 10 m wind exceeds 15 km/h, gusts exceed 30 km/h, 6-hour rain exceeds 1 mm, temperature is above 36 °C or below 4 °C, or relative humidity drops below 35%. It marks it marginal on milder versions of the same — and, less obviously, when wind falls below 2 km/h. Dead calm is not ideal spraying weather: still air under an inversion lets fine droplets hang and drift rather than deposit.
Disease pressure
Prolonged leaf wetness drives fungal infection. When relative humidity stays above 92%, or fog probability above 40%, on two or more days in the period, the advisory flags elevated fungal-disease pressure and points at the next dry window for a protective spray. Gust and thunderstorm days are separately flagged for lodging risk in standing crops, and for supporting orchards and trellises.
What You Actually Get: The 10-Day Agro Meteogram
Thresholds are the machinery, not the product. The deliverable is a ten-day chart for a single district, refreshed every model run, in which the two windows are rendered as colour strips you read left to right — so the question "which days can I sow, and which can I spray?" is answered by looking, not by calculating.
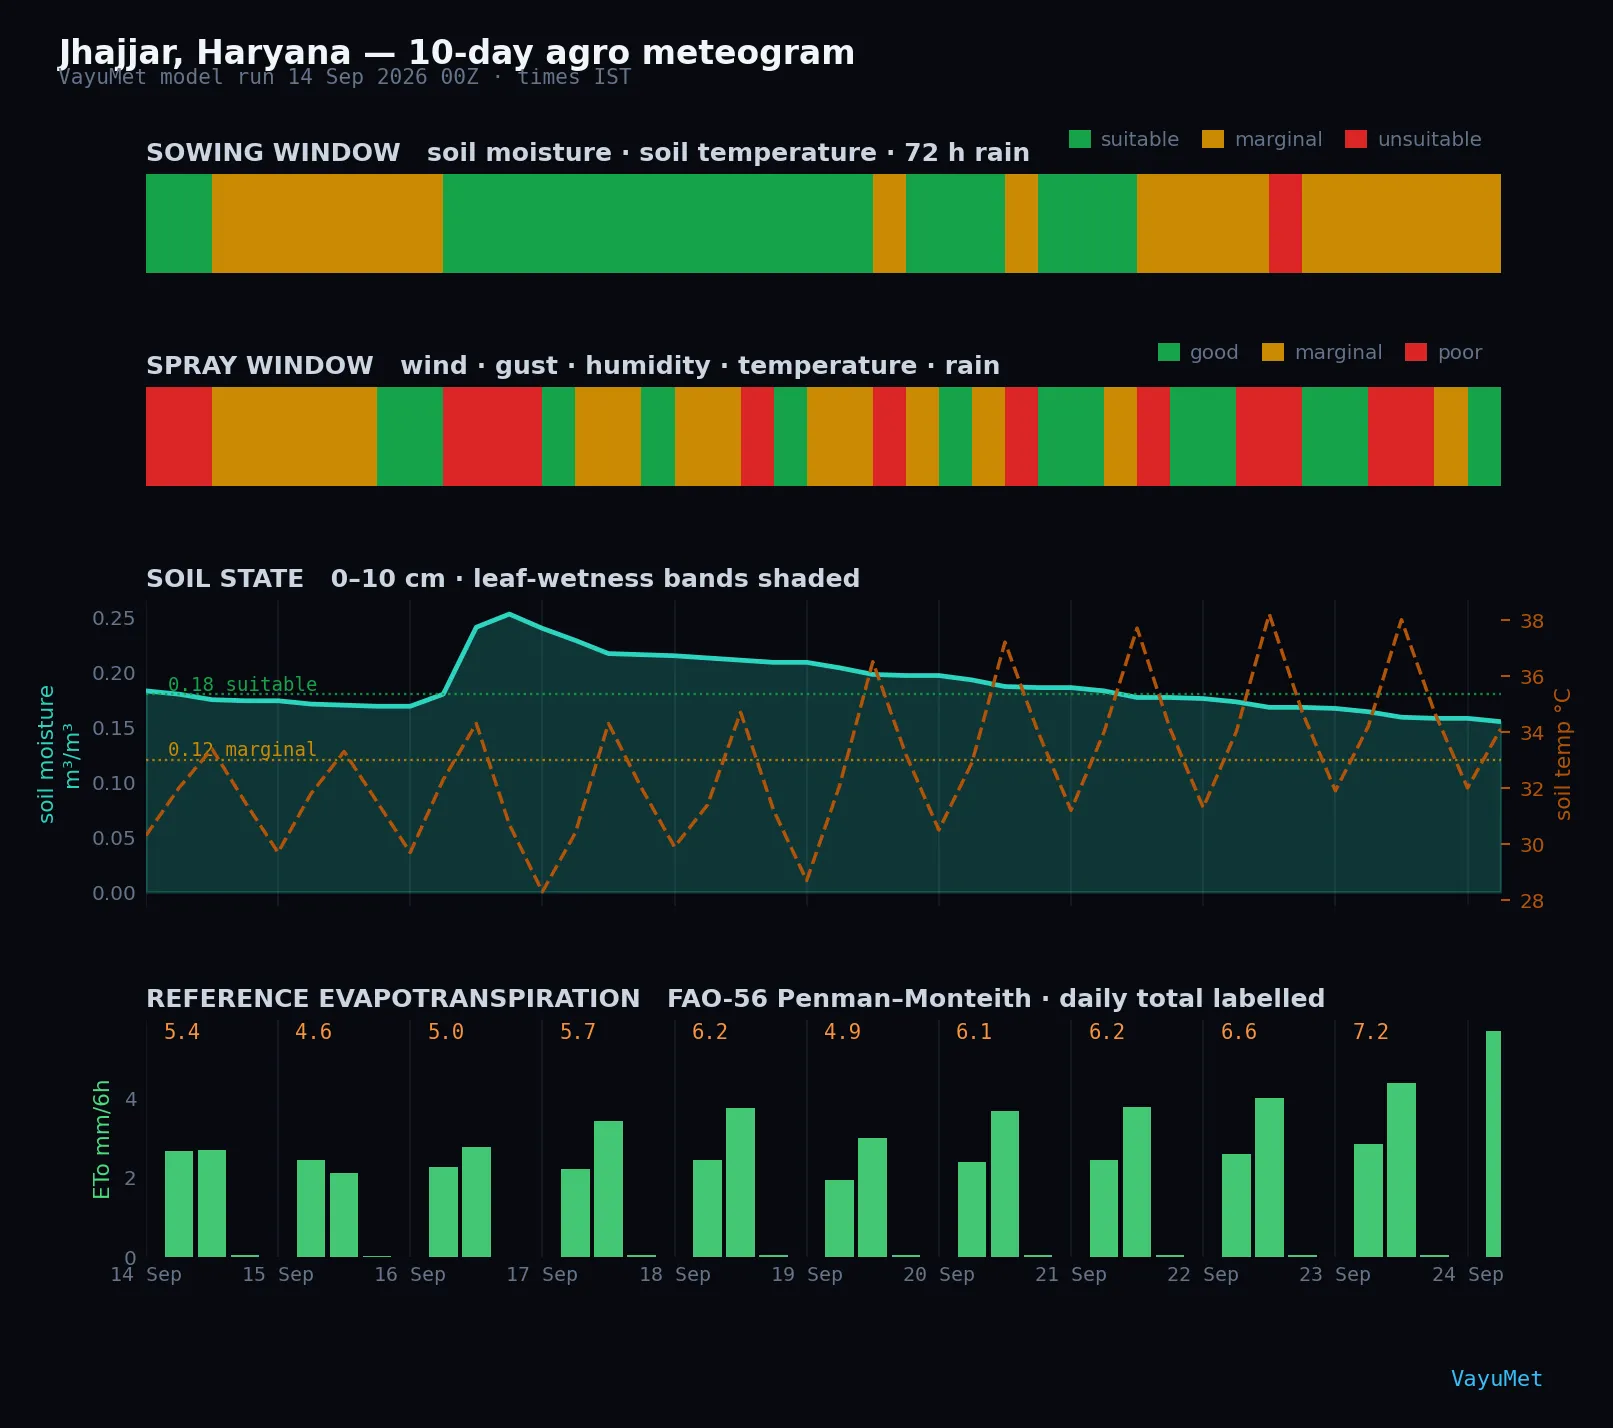
The full Agriculture tab carries seven stacked panels for any district: air and soil temperature; 6-hourly rainfall split into total and convective showers with relative humidity overlaid; the spray strip; the sowing strip; FAO-56 ETo in 6-hourly bars with daily totals labelled; soil moisture and temperature with leaf-wetness bands shaded on top; and — pointedly labelled wind (spray drift) — 10 m wind, gusts and direction barbs.
Beneath the chart the same rules are restated as prose with actual dates attached — "spraying favourable on 15–17 September, 20 September" rather than a classification you have to decode. That conversion from strip to named dates is the part that makes it usable in the morning without reading a chart at all.
How VayuMet Computes It
The soil fields come from the VayuMet model's 0.25° output, four runs daily, out to ten forecast days:
| Quantity | Source field | Depth / unit |
|---|---|---|
| Seed-zone moisture | SOILL — liquid volumetric soil moisture | 0–0.1 m · fraction |
| Seed-zone temperature | TSOIL — soil temperature | 0–0.1 m · °C |
| Crop-water demand | FAO-56 Penman–Monteith ETo | mm/day, split 6-hourly |
| Washout & supply | 6-hourly and 72-hour accumulated rainfall | mm |
Using the liquid soil moisture field rather than total soil water matters in the Himalayan and northern-plain winter: frozen water in the profile is not available to a germinating seed, and counting it would overstate readiness exactly when it is least true.
What It Cannot Tell You
- It is a 25 km grid, not a soil sensor. One cell spans an entire block. It cannot see that your lower field drains poorly while the upper one is already fit, and it does not know your soil type, texture or organic matter.
- It has no crop in it. These are generic agrometeorological thresholds. They do not encode variety, duration, sowing depth or local package-of-practices guidance — all of which shift the window.
- Modelled soil moisture is a model state. It is the land-surface scheme's estimate given the modelled weather, not a measurement, and it inherits any rainfall error that preceded it.
- It does not replace extension advice. Treat it as the meteorological half of the decision, alongside the agricultural half from your Krishi Vigyan Kendra or state agriculture department.
The immediate application is rabi. Sowing runs roughly October into December across much of the country, on residual moisture left by the withdrawing monsoon plus irrigation. That is precisely the situation the moisture-versus-demand comparison is built for: supply is fixed and falling, demand is the variable, and the window closes.
The soil layers sit in the Agriculture group of the main map, and the per-district sowing, spray and irrigation advisories — with the dates they apply to — are on the District 10-Day Forecast.
Open the District Forecast →