Why India Doesn't Warm as One Country — Reading the District Climate Record, 1951–2025
A forecast of 180 mm tells you almost nothing on its own. Whether that is a routine week or the wettest in twenty years depends entirely on what the district normally receives — and on whether that normal has itself been moving. Climatology is the baseline that makes every forecast interpretable, and at district scale it turns out to carry a result that the national average completely hides: India is warming almost everywhere, but the fastest region heats nearly five times faster than the slowest, and there is a warming hole sitting over the country's most populous, most food-critical belt.
What District Climatology Contains
Three distinct things, often confused with one another:
- Normals — the 1991–2020 average conditions for a place and a date. This is what "normal for this time of year" means, and it is the reference every anomaly is measured against.
- Distributions — not just the average but the spread: how many rain days a district gets in a typical July, how often the maximum exceeds 40°C, what an unusually dry week actually looks like there. A mean alone hides the tail, and the tail is usually what causes the damage.
- Trends — how the normals themselves have shifted over the record. This is the part that turns a reference table into a statement about change.
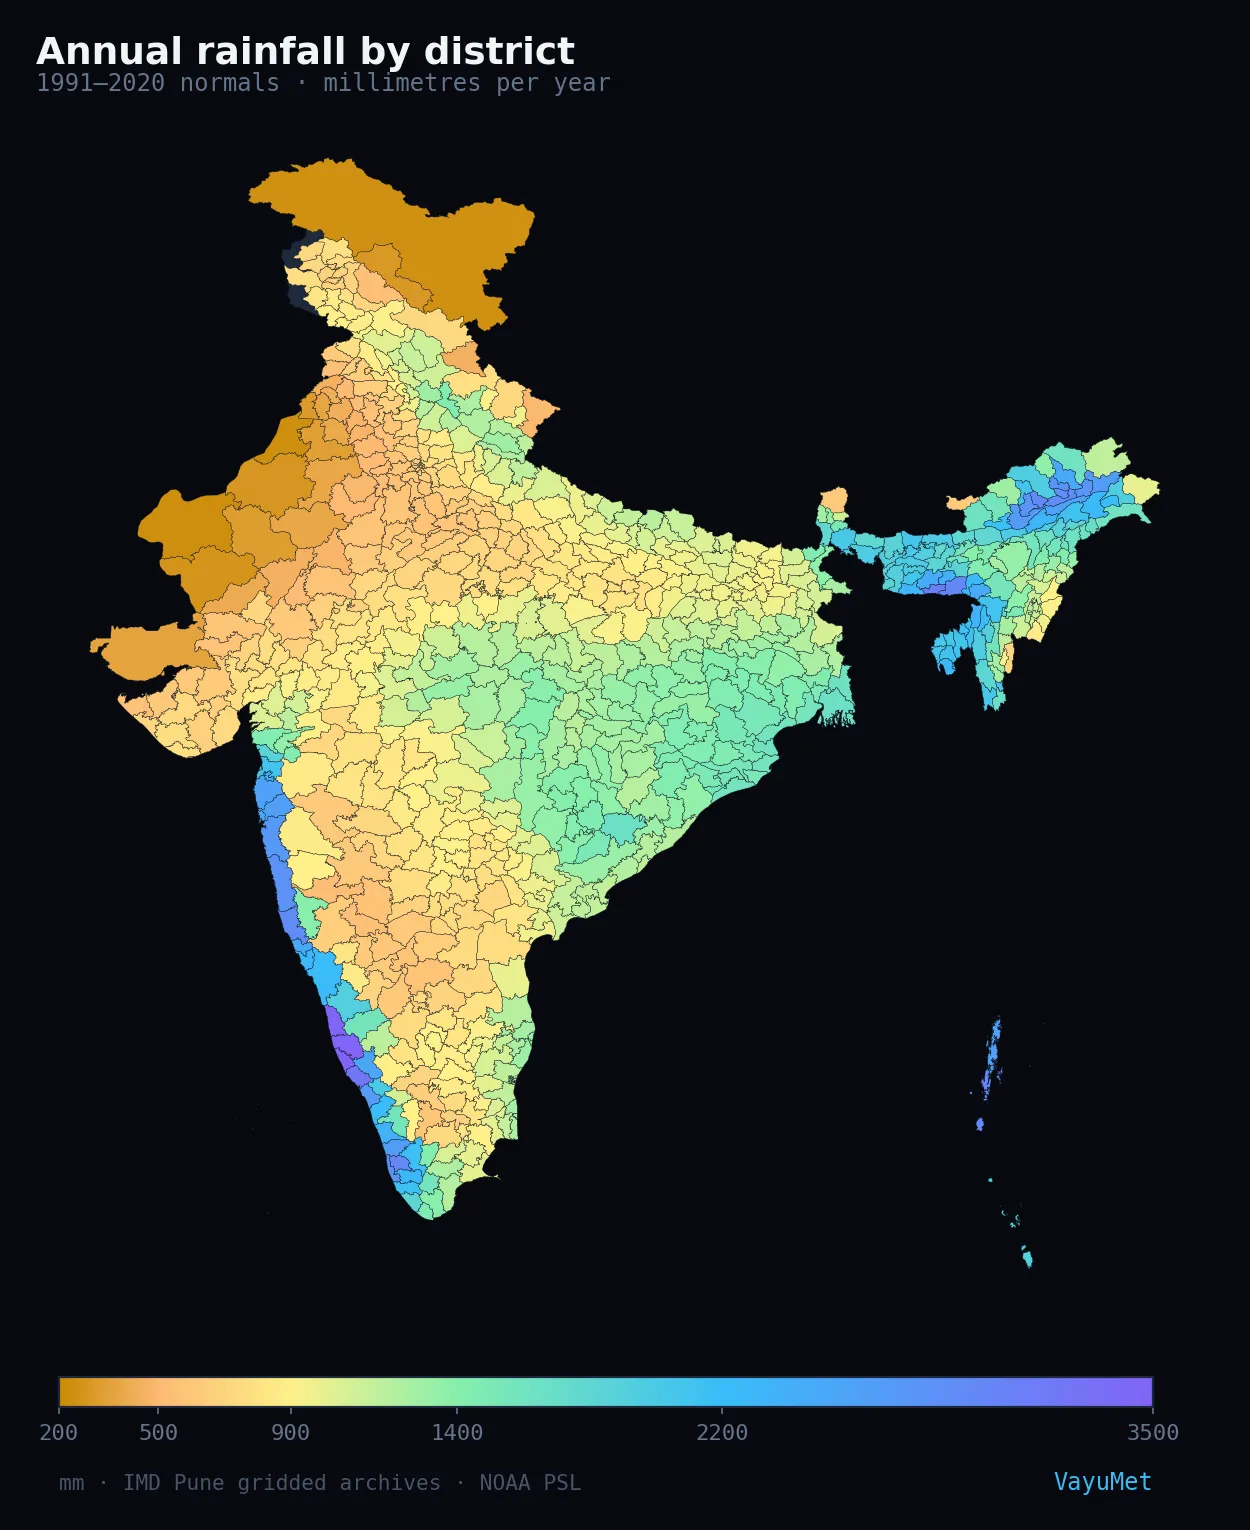
The first thing the district view establishes is that "normal" is a local quantity, not a national one. Annual rainfall across India's districts spans roughly 226 mm to 4,083 mm — an eighteen-fold range inside one country:
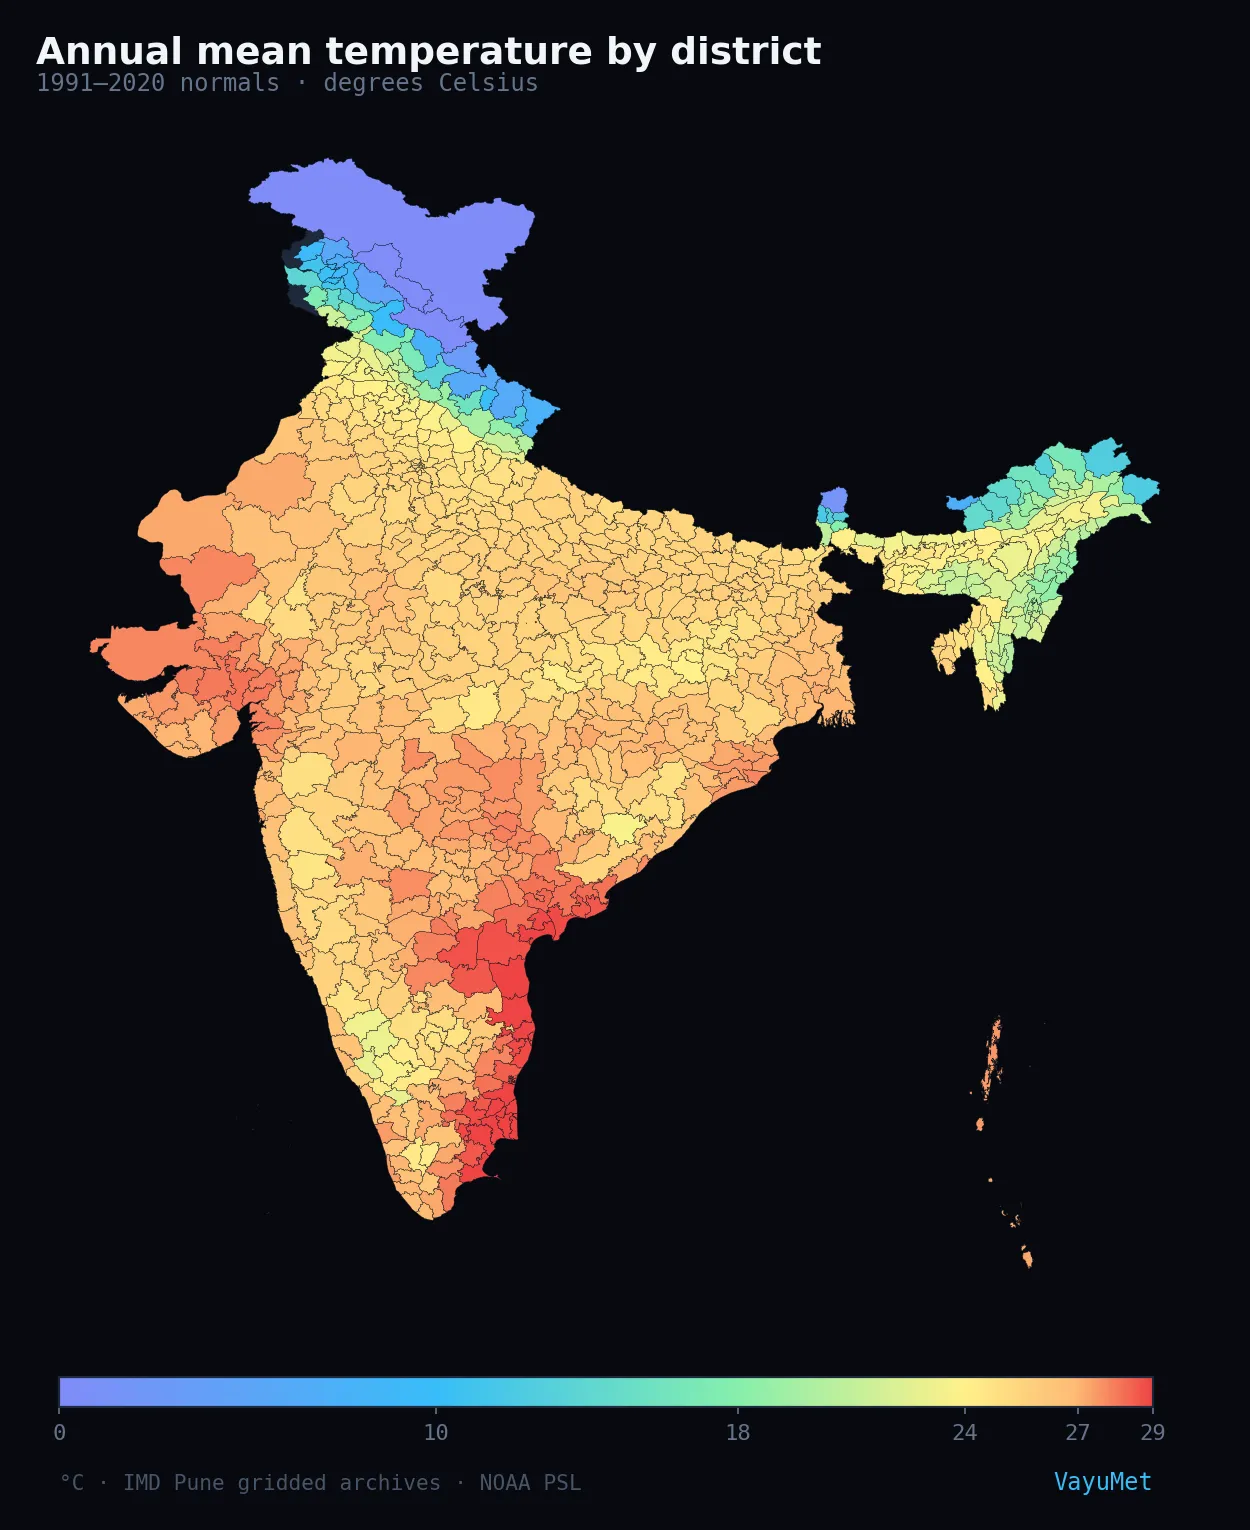
Temperature normals vary just as widely — from around −2°C in the high Himalaya to nearly 30°C along the southern coasts — which is why a single national temperature threshold is meaningless as an operational trigger:
Why It Decides How a Forecast Is Read
Climatology is not a historical curiosity sitting beside the forecast. It does three working jobs:
It supplies the anchor. An anomaly map is meaningless without a baseline — "40 mm above normal" requires the normal. Every departure-based product on VayuMet, including the seasonal anomaly maps, resolves against this reference.
It corrects the forecasts. Seasonal model output carries systematic biases. VayuMet bias-corrects its seasonal CFSv2 forecasts against IMD reference climatology — so the climate record is not just displayed, it actively adjusts what the seasonal forecast shows.
It sets the planning baseline. Infrastructure, cropping calendars, insurance and procurement are all sized against what a place normally gets. If the normal is moving, and moving at very different speeds in different districts, then a plan calibrated to a national figure is likely to be wrong in both directions at once.
What Seventy-Five Years Actually Show
If the normals are local, so is the change. Across 755 districts, 751 have warmed since 1951. The district-mean rate is +0.072 °C per decade — modest, and tightly clustered. That single number is also where the national picture stops being useful, because the geography underneath it is strong enough to see at a glance:
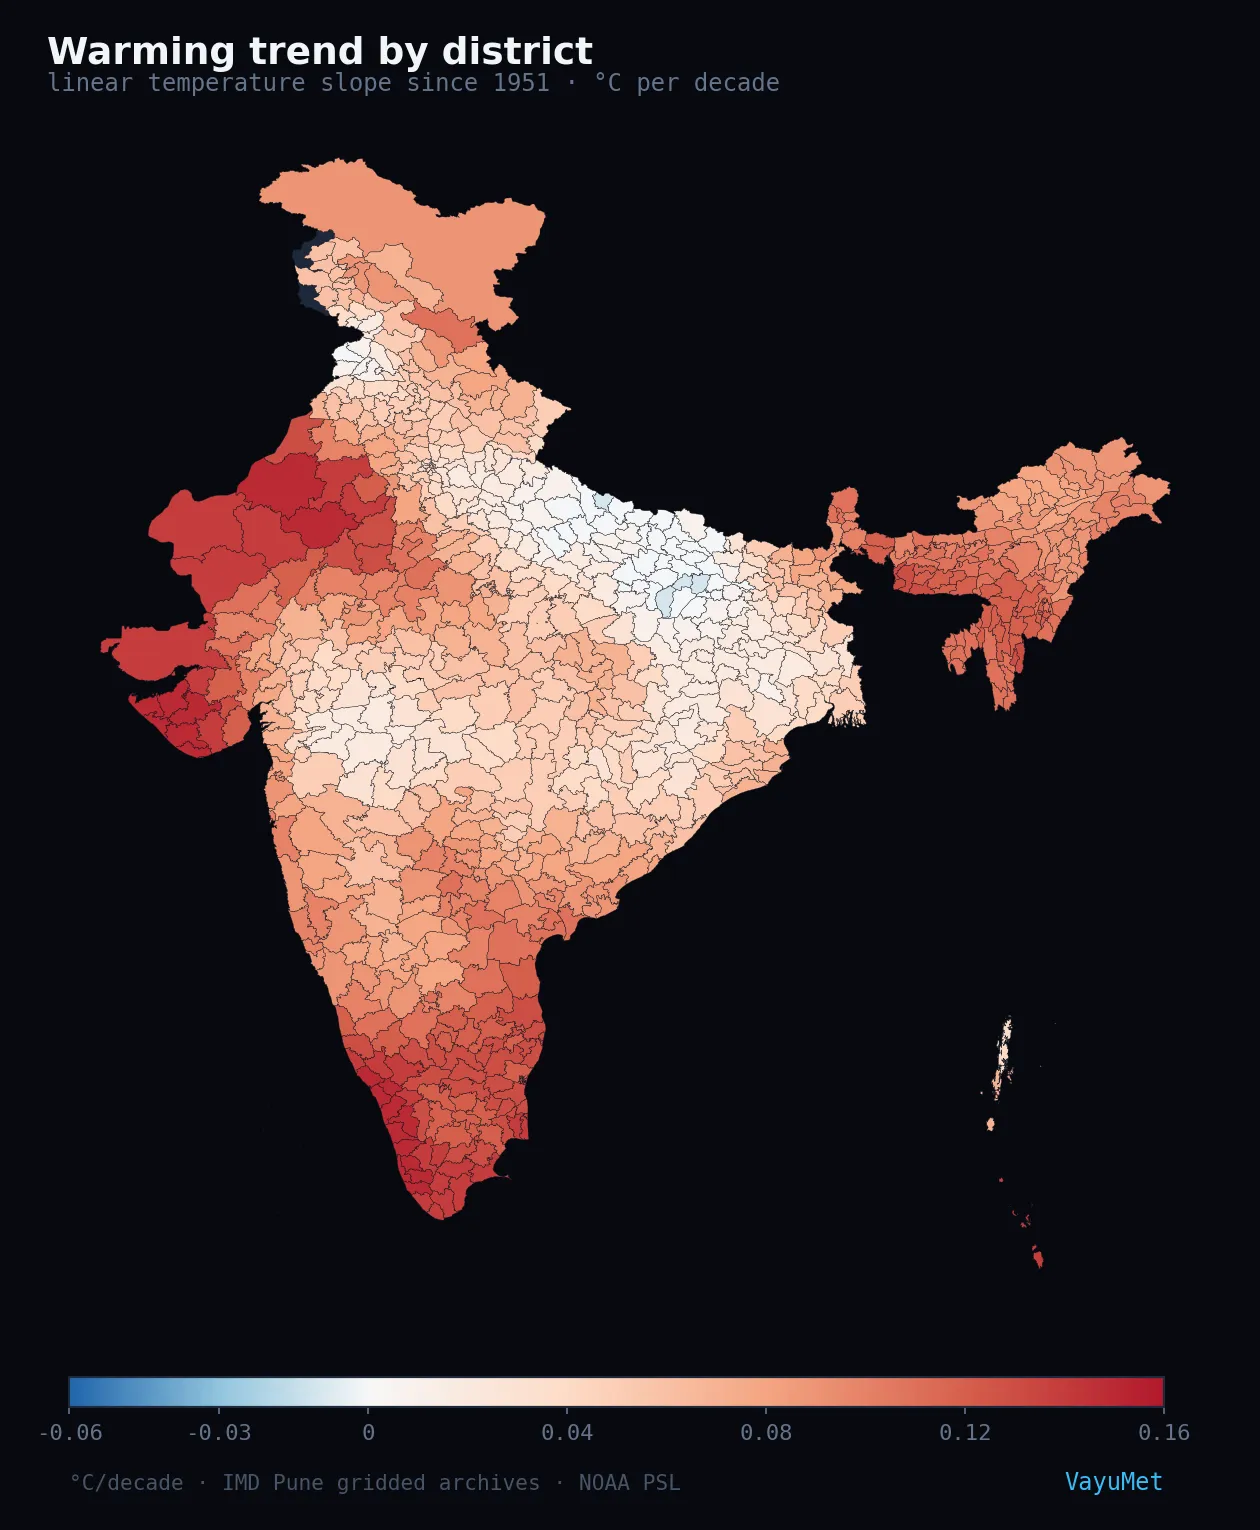
That pale corridor is the whole argument for district resolution. Averaged into a national figure it disappears; averaged into state figures it is blunted. Fitted district by district it is impossible to miss:
| Region | °C / decade | Reading |
|---|---|---|
| Deep South (≤15°N) | +0.127 | Fastest — ringed by the warming tropical Indian Ocean |
| Northeast hills | +0.104 | Fast |
| Arid Northwest | +0.100 | Dry-land amplification — little soil moisture to evaporate |
| Peninsular (15–21°N) | +0.073 | Near the national district mean |
| North / Himalayan (≥28°N) | +0.055 | Middle |
| Central India | +0.051 | Middle |
| Indo-Gangetic Plain | +0.030 | The warming hole — 55 of its 179 districts at or below +0.01 |
At the extremes the contrast is sharper still: Lakshadweep leads at +0.170 °C per decade, with Wayanad, Thrissur, Porbandar, Gir Somnath, Bikaner and Mahe at +0.150. At the other end sit Kaimur, Bhojpur and Buxar in Bihar and Shrawasti in eastern Uttar Pradesh — the only four districts in the country with a slightly negative slope, none exceeding −0.01.
Why the hole is there — and why it is temporary
The pattern is legible rather than random. The peninsular maximum tracks the tropical Indian Ocean, which has warmed roughly 1 °C since 1951 and is the fastest-warming tropical basin on record; districts pressed against that water inherit its heat.
The plains behave differently for a reason that connects directly to the air quality story: dense aerosol pollution over the Indo-Gangetic Plain dims incoming sunlight and cools the surface, while intensive irrigation adds evaporative cooling. Together they have masked much of the greenhouse warming there for decades. The uncomfortable corollary, widely noted in the attribution literature, is that the mask is likely to lift as India cleans its air — and the warming hole to fill.
Rainfall is a noisier signal and splits almost evenly: 359 districts trending wetter against 387 drier, so there is no single national direction. The structure still says something — the Indo-Gangetic Plain is drying at roughly −20 mm per decade, consistent with the weakening land–sea thermal gradient a rapidly warming ocean produces. The honest summary is redistribution rather than increase.
The full analysis, with the district tables, distributions and attribution sources, is in The Uneven Heat: District-Scale Warming Across India, 1951–2025.
How VayuMet Builds It
These pages are built from long-term observed and reanalysis archives rather than forecast model output — a different data lineage from everything else on the site.
Source archives
| Dataset | Operator | Resolution | Period |
|---|---|---|---|
| IMD daily gridded (rain, tmax, tmin) | India Meteorological Department, Pune | 0.25° rain · 1° temp | 1951–2025 |
| CPC gridded daily climatology | NOAA Physical Sciences Laboratory | ~0.5° | 1991–2020 normals |
| NCEP-DOE Reanalysis 2 (10 m wind) | NOAA Physical Sciences Laboratory | ~1.9° | 1996–2025 |
| NCEP monthly cloud climatology | NOAA Physical Sciences Laboratory | ~2° | 1979–2025 |
Trends are fitted per district rather than per state — a linear slope through each district's own series, not a national curve sampled locally. The difference is not cosmetic: a state mean averages Kerala's fast-warming coast with its interior, burying exactly the within-state divergence that adaptation planning has to deal with.
Where the Record Thins Out
- Temperature is gridded at 1°, not 0.25°. That is roughly 110 km. Districts smaller than a grid cell share the underlying data with their neighbours, so district-to-district differences at fine scale should be read as regional signal, not as precise local values.
- Northeast rainfall magnitudes are uncertain. The rain-gauge network there is sparse; the wettest and driest trending districts in the Northeast are indicative rather than settled.
- A trend is not a forecast. A district warming at +0.15 °C per decade is a statement about seventy-five years of record, not a prediction for next summer.
- The national figure and the district mean differ legitimately. India's commonly cited national warming of about 0.7 °C comes from area-weighted national analysis over a longer window; district-averaging gives equal weight to the many slow-warming plains districts and lands lower. Neither is wrong — they answer different questions.
The per-district series are open in the District Climatology map, where the Warming Trend layer renders the same numbers district by district, alongside normals and day-count distributions.
Open the Climatology Map →