Punjab Isn't Burning Yet. That's a Postponement, Not a Pardon.
Put last year's satellite frame next to this year's and the difference is almost shocking. On 12 October 2025, NASA's fire sensors lit up Punjab like a circuit board. On 12 October 2026 — the same calendar date, the same patch of earth — there is almost nothing there. Rain across the northwest has been doing the job that no policy has yet managed: wet fields cannot be set alight, and wet air cannot hold smoke. Nature is running the air purifier. The problem is that we can see, in the model, exactly when it switches off.
Two Octobers, One Week Apart on the Calendar
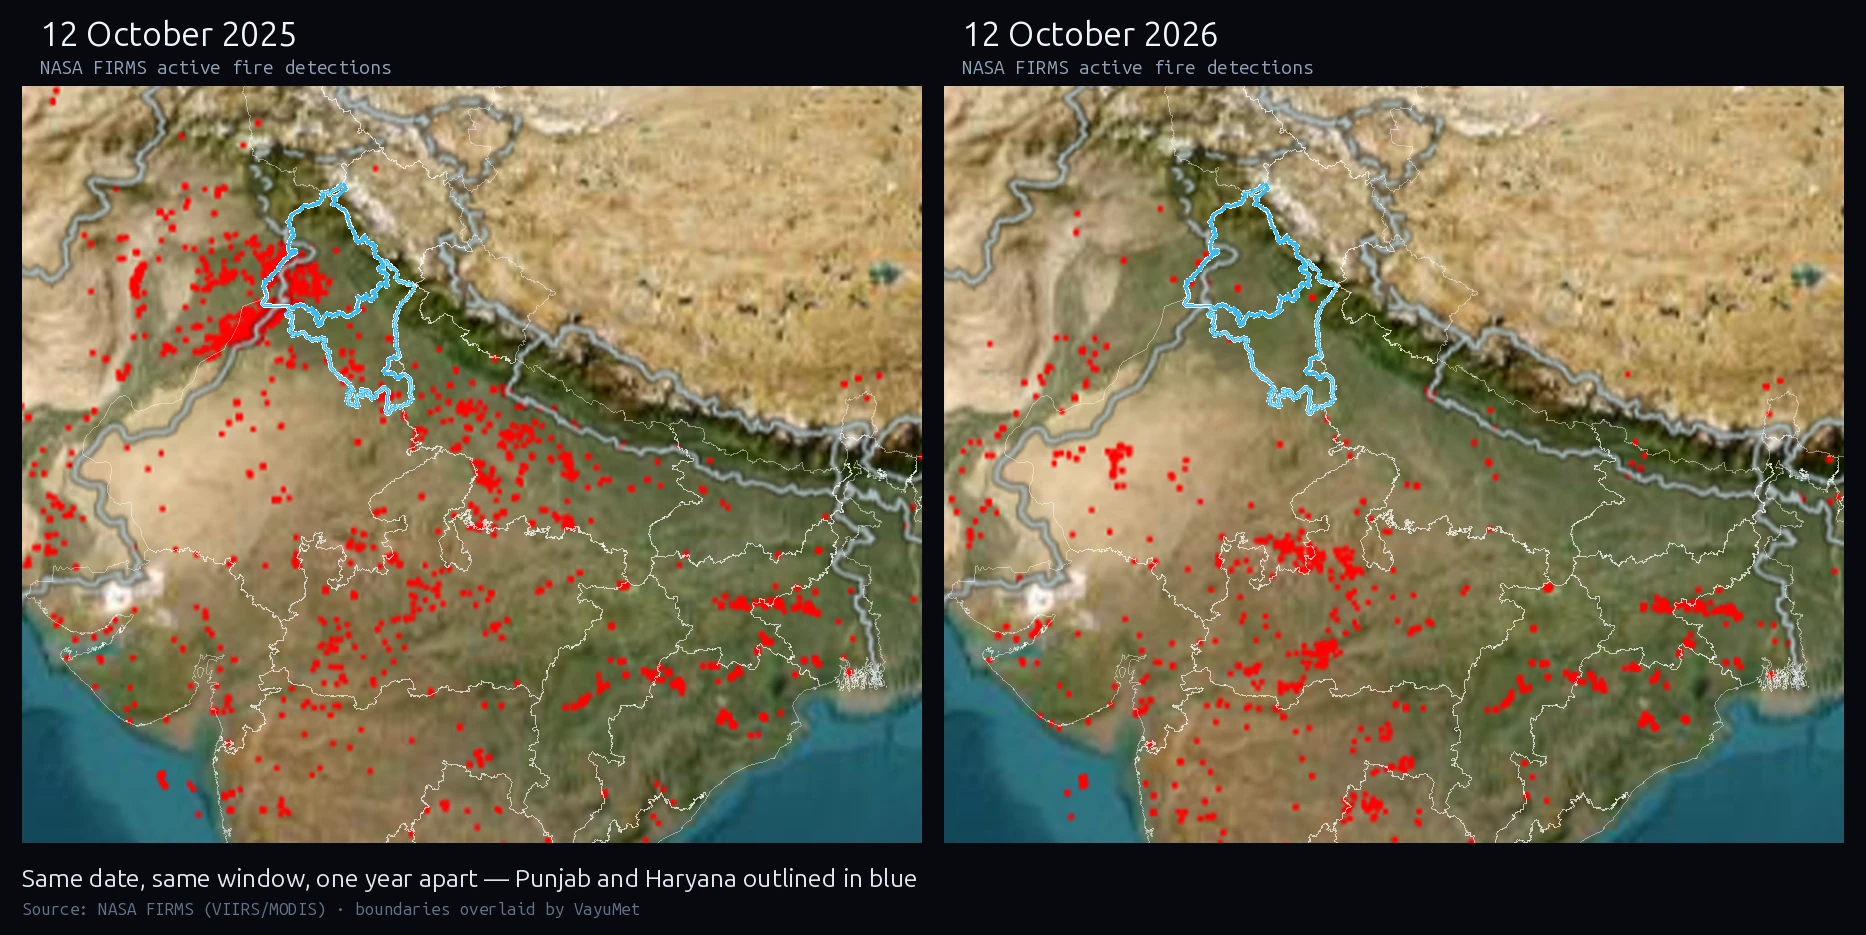
NASA FIRMS active fire detections, 12 Oct 2025 and 12 Oct 2026, cropped to the same window with Indian state boundaries overlaid by VayuMet · Punjab and Haryana outlined in blue
In 2025 the cluster is unmistakable and it straddles the border, Indian Punjab and Pakistani Punjab burning together. In 2026 that same ground is clear; what fire activity there is has moved to central India and the northeast, which is ordinary forest-and-field burning, not the paddy-residue signal.
And "has not started" is the whole point. The crop still has to come off. A delayed harvest does not cancel the stubble; it compresses the window in which farmers must clear their fields before sowing wheat. The same volume of residue, burned over fewer days, in worse air.
Why This Happens Every Year — Four Problems, Same Six Weeks
The Indo-Gangetic winter smog is not one problem. It is four, and they converge on the same handful of weeks every autumn.
a. The source — crop residue burning. Farmers in Punjab and Haryana burn rice stubble in October and November to clear fields for wheat. During peak burning weeks this adds 50–75% more PM2.5 and 40–45% more coarse particulate to Delhi's air.
b. The lid — meteorology. Temperature inversions trap pollutants close to the ground, while low wind speeds and a shallow boundary layer stop what is already there from dispersing. Meteorological variability alone can swing Delhi's PM2.5 by ±27 µg/m³, a 24–36% difference, with no change in emissions at all.
c. The floor — urban and industrial emissions. Vehicle exhaust, construction dust and coal-fired power keep a constant baseline of roughly 60–100 µg/m³ running underneath everything else, all year round.
d. The box — Indo-Gangetic geography. The plain is walled in: the Himalaya along the north, the Vindhyas and the Deccan rise to the south. Winds that would otherwise flush the basin are blocked at both ends, so emissions accumulate instead of leaving. This is why the same tonnage of smoke does so much more damage here than it would anywhere else in India.
| Factor | Contribution | Typical PM2.5 impact |
|---|---|---|
| Crop burning smoke | 50–75% rise in PM2.5 | +100–150 µg/m³ in Delhi |
| Temperature inversion | 84% of fine particulate episodes | sustains 200–500 µg/m³ |
| Meteorological variability | 24–36% swing | ±27 µg/m³ |
| Urban / industrial baseline | constant emissions | ~60–100 µg/m³ |
Published source-apportionment ranges for the Oct–Dec season, not VayuMet model output.
What the Air Is Doing Right Now
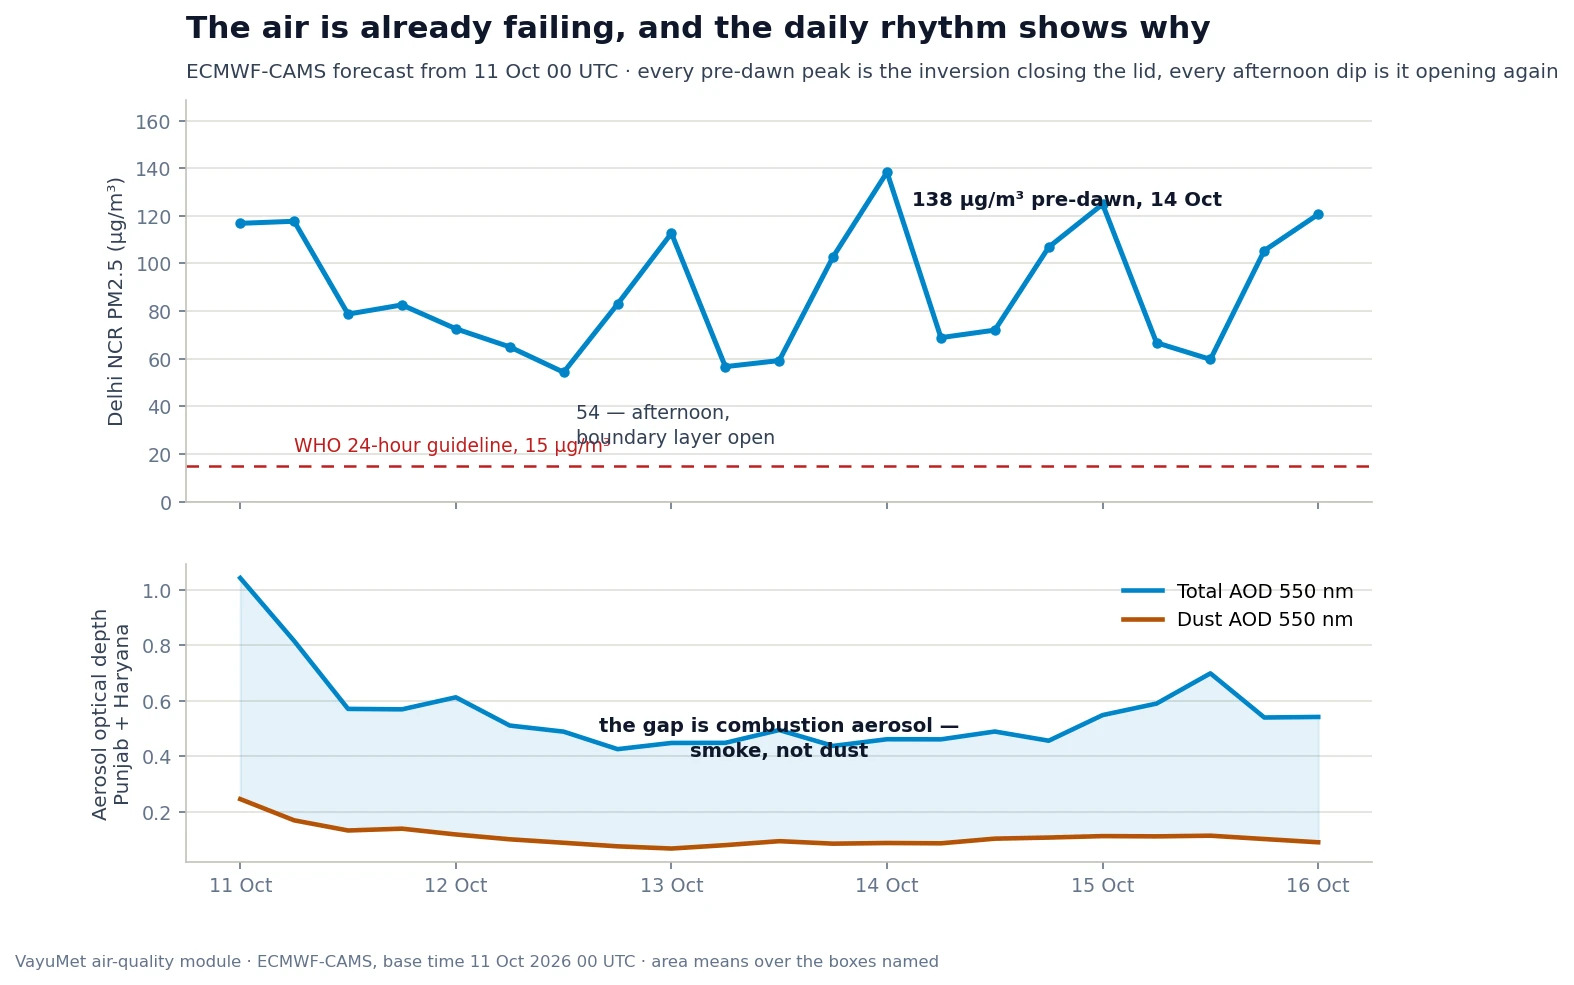
ECMWF CAMS, base time 11 Oct 2026 00 UTC · Delhi NCR PM2.5 and the aerosol optical depth split over Punjab and Haryana, as carried in VayuMet's air-quality module
Even without the fires, the air is already failing. ECMWF CAMS has Delhi NCR swinging between about 54 µg/m³ in the afternoon and 138 µg/m³ before dawn — and that sawtooth is the inversion, drawn in data. Each night the lid closes and the same emissions concentrate into a shallower and shallower layer; each afternoon the sun reopens it. The pre-dawn peak is already nine times the WHO 24-hour guideline of 15 µg/m³, before a single stubble fire has been lit.
The lower panel answers a question that usually gets argued rather than measured: what is actually dimming the sky? Total aerosol optical depth is plotted against the dust-specific AOD, and the dust line stays far below the total all week. The shaded gap between them is combustion aerosol — smoke and exhaust rather than blown sand.
The Reprieve Has an Expiry Date
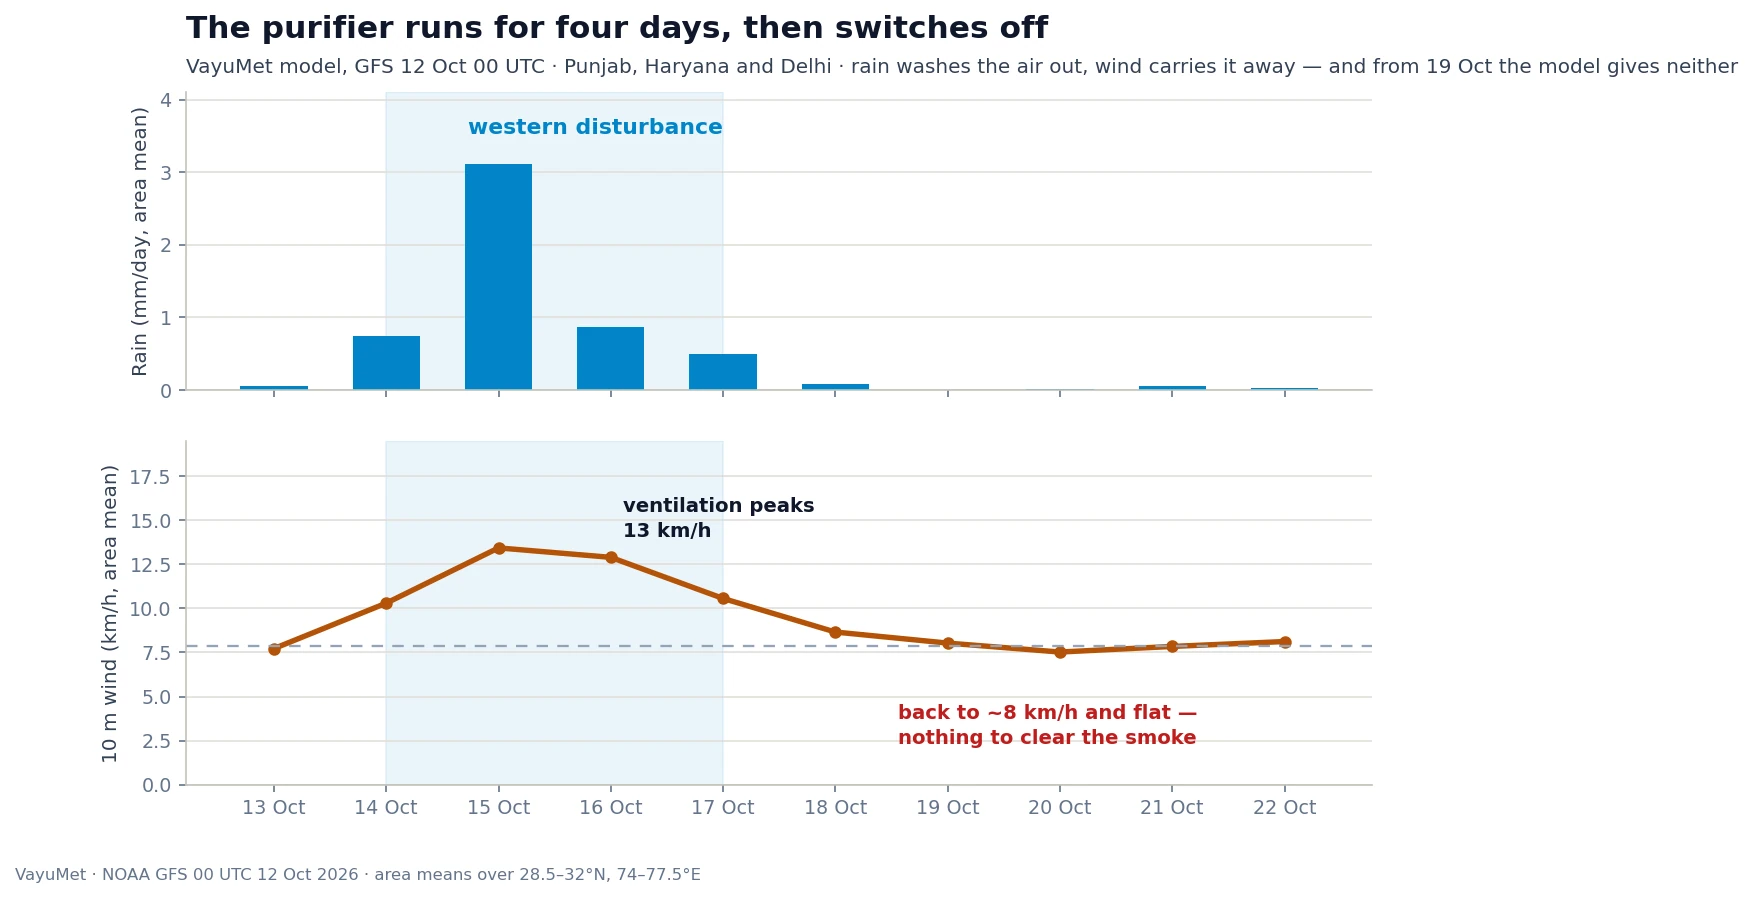
VayuMet model, NOAA GFS 00 UTC 12 Oct 2026 · area means over Punjab, Haryana and Delhi — the shaded band is the western disturbance
A western disturbance is the north's only reliable ventilator in this season. It does two things at once: rain scavenges particulate straight out of the column, and the pressure gradient behind it lifts surface winds enough to flush the plain. The model has one working now. Rain peaks around 15 October and the 10 m wind climbs from roughly 8 km/h to 13 km/h on 15–16 October.
Then it stops. From 18 October the rain goes to zero, and the wind settles back to about 8 km/h and stays flat for the rest of the run. No washout, no flushing — and by then the harvest will be further along and the burning window narrower.
The forewarning, in one line: the cleanest air the northwest will see this month is 15–17 October. From roughly 18–19 October the atmosphere stops ventilating just as the fire count should begin climbing. Plan outdoor work, school sport and construction scheduling around that hinge, not around today's clear sky.
How VayuMet Watches It
Alongside PM2.5 and PM10, VayuMet's air-quality module carries total aerosol optical depth and a dust-specific AOD from ECMWF CAMS. Reading the two together decomposes a bad-air day into its cause instead of leaving it to argument:
- High total AOD + high dust AOD → mineral dust dominant, usually weighted to the coarse fraction.
- High total AOD + low dust AOD → combustion aerosol dominant. This is the signature the plain is showing today.
- Rising total AOD + flat dust AOD → a combustion source is growing. On this calendar, that is the stubble signal starting.
That third line is the one to watch over the next fortnight. It is the earliest honest warning the data can give, and it will show up before the AQI stations do.
Why it matters. Through the worst of the season, PM2.5 across northern India runs tens of times the WHO annual guideline of 5 µg/m³ — an exposure associated with roughly 3.5 years off life expectancy in the region. The fires are late this year. The arithmetic is not forgiving about what happens when they arrive into air that has stopped moving.
Comments
⚠ Disclaimer
VayuMet's analysis is based on NOAA GFS and ECMWF CAMS model output and represents independent meteorological assessment. Before taking any decision based on weather or air-quality forecasts, always consult your national official meteorological broadcaster and the Central Pollution Control Board for authoritative guidance.
Data Source: Fire detections: NASA FIRMS (VIIRS/MODIS), frames supplied as downloaded — state boundaries were georeferenced and overlaid by VayuMet · Air quality: ECMWF CAMS, base time 11 Oct 2026 00 UTC, area means over the boxes named · Rain and wind: NOAA GFS 00 UTC 12 Oct 2026 · Source-apportionment percentages in the table above are published literature ranges, not VayuMet output, and are included for context · Model guidance only — verify against CPCB and IMD bulletins.