Severe Turbulence Dropped a Delhi-Bound Airbus 425 Feet in Seconds — the In-Flight Hazard That No Ground Weather Station Can See
On the morning of 04 August 2026, an Airbus A320neo cruising at 36,000 feet over northern Madhya Pradesh dropped and recovered 425 feet in a matter of seconds. There was no radar echo beneath it, no warning from any surface observation, and nothing on a rain gauge anywhere in India that would have hinted at it. Everyone on board walked off at Delhi. That outcome was not guaranteed — and the gap it exposes is one worth talking about.
What happened: Air India AI2379 (Airbus A320neo, VT-EXO) departed Phuket at 06:57 IST with 137 passengers and 8 crew. Cruising at Flight Level 360 (36,000 ft), it met severe turbulence between 09:33 and 10:09 IST, roughly 32 km north of Rewa. Automatic Dependent Surveillance–Broadcast (ADS-B) telemetry logged a swing from 36,175 ft down to 35,750 ft. The crew stepped down to FL320 and then FL280 to exit the layer and landed at Delhi at 11:07 IST. The Directorate General of Civil Aviation (DGCA) has secured the Flight Data Recorder (FDR) and Cockpit Voice Recorder (CVR).
Turbulence Is the Hazard That Gives No Warning
Of all the weather that touches a flight, turbulence is the one with the shortest reaction time. A thunderstorm can be seen on radar and routed around thirty minutes out. Fog is forecast the night before. Icing announces itself as the aircraft enters a known temperature and moisture band. Turbulence gives none of that. It is invisible, it has no smell or sound, and the interval between the first jolt and the worst of it is often measured in seconds — usually less time than it takes to complete a cabin announcement.
It is also the most common cause of in-flight injuries in commercial aviation, and almost all of those injuries are to people who were not strapped in. The aircraft is built to take the load; an unrestrained body in the cabin is not. A 425-foot excursion is no structural event for an A320neo — but for an unbelted passenger or a cabin crew member mid-service, it is the difference between a stumble and a spinal injury.
Nothing on the Ground Was Ever Going to See It
This is the part that deserves more attention than it usually gets. India's surface observing network — automatic weather stations, rain gauges, airport observations — measures the atmosphere at ground level. The AI2379 encounter happened roughly 11 kilometres above those instruments. There is no surface pressure trace, no wind gust, no rainfall total anywhere in Madhya Pradesh that carries a signature of what happened at FL360 that morning.
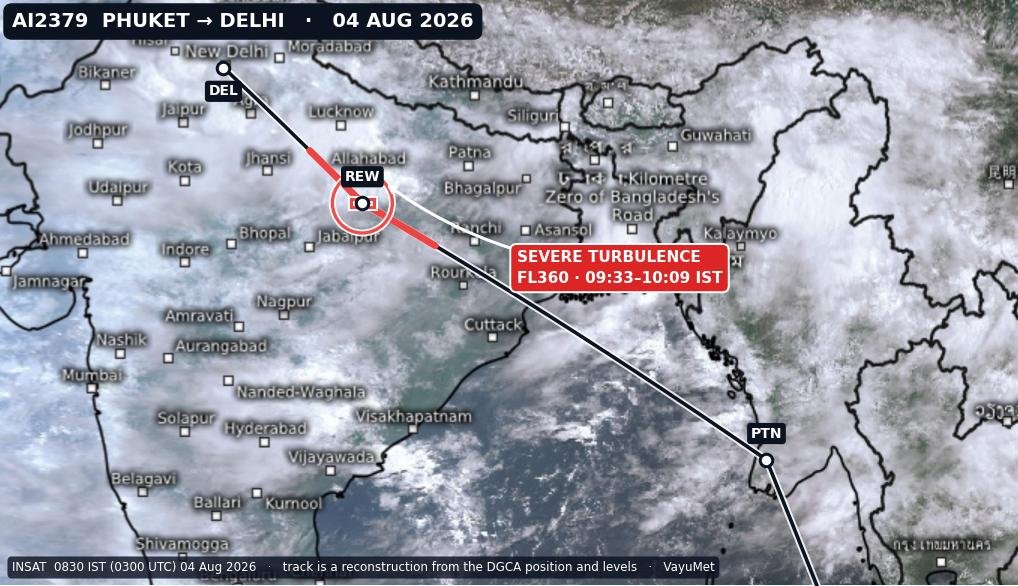
Satellite imagery gets closer, but only halfway: it shows cloud tops, not air motion. Radar detects precipitation, not clear air. And crucially, the turbulence that injures people at cruise level often occurs outside visible cloud — beside a storm, or above its top — where there is nothing for radar or the eye to register. On the satellite image below, taken at 08:30 IST that morning, the reconstructed track crosses an unbroken monsoon cloud shield. Nothing in it distinguishes the segment where the aircraft was thrown from the hundreds of kilometres either side where it was not.
What the Model Shows Along the Track
VayuMet built a significant weather (SigWx) cross-section along the reconstructed track, taking the worst case across the 03:00 and 06:00 UTC steps of the 04 August 00 UTC cycle — the window bracketing the encounter. The result is worth stating carefully, because it cuts against the obvious assumption.
Inside the reported area, at the reported level, the VayuMet model shows no clear-air turbulence signature at all. The Ellrod index — the standard diagnostic for shear-driven turbulence — peaks at about a quarter of the threshold for moderate turbulence. Vertical wind shear is 2.4 knots per 1,000 feet, and the wind is a light 25 knots. There is no jet stream anywhere near the encounter, and no shear layer for classical clear-air turbulence to form in.
What the model does show is convection. Cloud cover at cruise level inside the reported area climbs from 9 % at 03:00 UTC to 90 % at 06:00 UTC — the atmosphere going from clear to solid at exactly the altitude the aircraft was flying, across exactly the window in which it was there. Cumulonimbus tops along the track reach FL460 to FL480, which is 100 to 120 flight levels above the cruise altitude. The aircraft was transiting beneath and alongside actively overshooting convective tops.
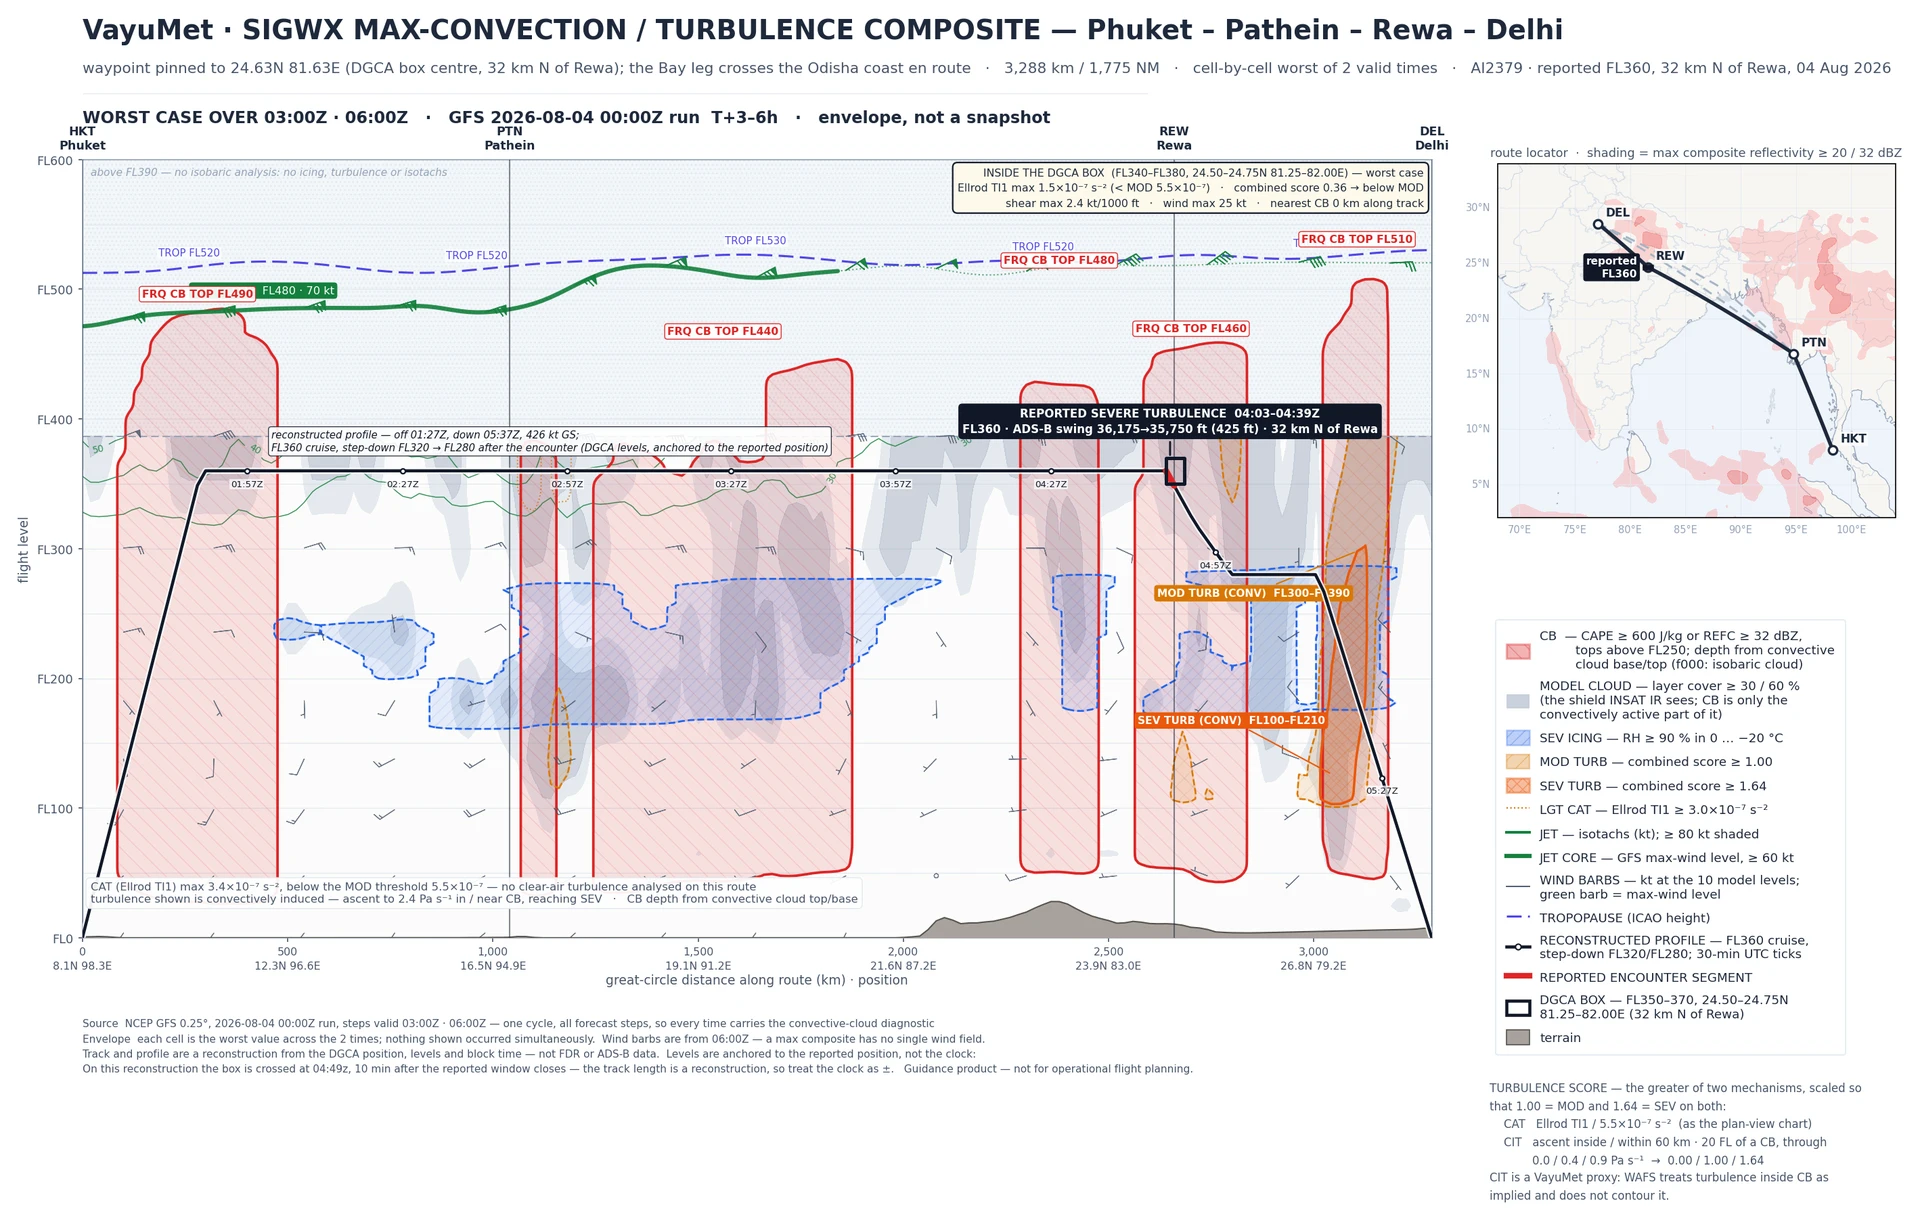
That distinction matters. Turbulence met in clear air is routinely reported as clear-air turbulence, but the two have different origins: shear-driven turbulence sits near jet streams, while convectively induced turbulence is thrown off by updraughts in and around cumulonimbus, reaching well outside the visible cloud and above its top. On this evidence the encounter is likely to belong to the second family — though the FDR and CVR now with the DGCA will settle that, not a model.
An honest limit: a null result here is not proof of absence. Global models resolve features of roughly 25 km, while the eddies that actually shake an aircraft are tens to hundreds of metres across. The model can only diagnose the environment that favours turbulence — never the turbulence itself. It rules clear-air turbulence out as a large-scale explanation, no more than that.
Why This Is a Weather Intelligence Problem
The uncomfortable summary is this: an encounter serious enough to ground an aircraft and pull its recorders left no trace in any ground-based observation, and only a partial one in satellite imagery. The information that would have been useful to that crew — that cumulonimbus tops were building to FL480 across their track, and that the cruise level would be inside cloud within the hour — existed only in a vertical picture along the route, at the right level, at the right time.
That is what decision-grade weather intelligence means in practice. Not a regional forecast, and not an observation network that stops at the surface, but a hazard picture resolved by flight level, by position along the route, and by time. The same picture that would have flagged this encounter is the picture that lets a dispatcher pick a cruise level with a smoother ride, or plan a small lateral deviation hours ahead instead of a reactive one that burns fuel.
Turbulence will never be forecast the way rainfall is. But the environment that produces it is — and the difference between a seat-belt sign switched on two minutes early and two minutes late is, quite often, the whole outcome.
The Encounter in Numbers
Comments
⚠ Disclaimer
VayuMet's analysis is based on NOAA GFS model output and represents independent meteorological assessment. Before taking any decision based on weather forecasts, always consult your national official meteorological broadcaster for authoritative guidance.
Data Source: GFS IC 00 UTC 04 Aug 2026 · Flight details as reported by DGCA / Air India / ADS-B tracking · Flight track and vertical profile are a VayuMet reconstruction from the reported position, levels and block time — not FDR or ADS-B data · Satellite image: INSAT 03:00 UTC 04 Aug 2026